
The wallpaper is the bar
If you came here from the homepage, you’ve already seen the scene: the curve of the Earth under the headline, a thin line of glowing air, a few sharp stars. It isn’t a video. Your browser draws every frame from the space station’s real orbit, a star catalog and NASA maps of the planet.
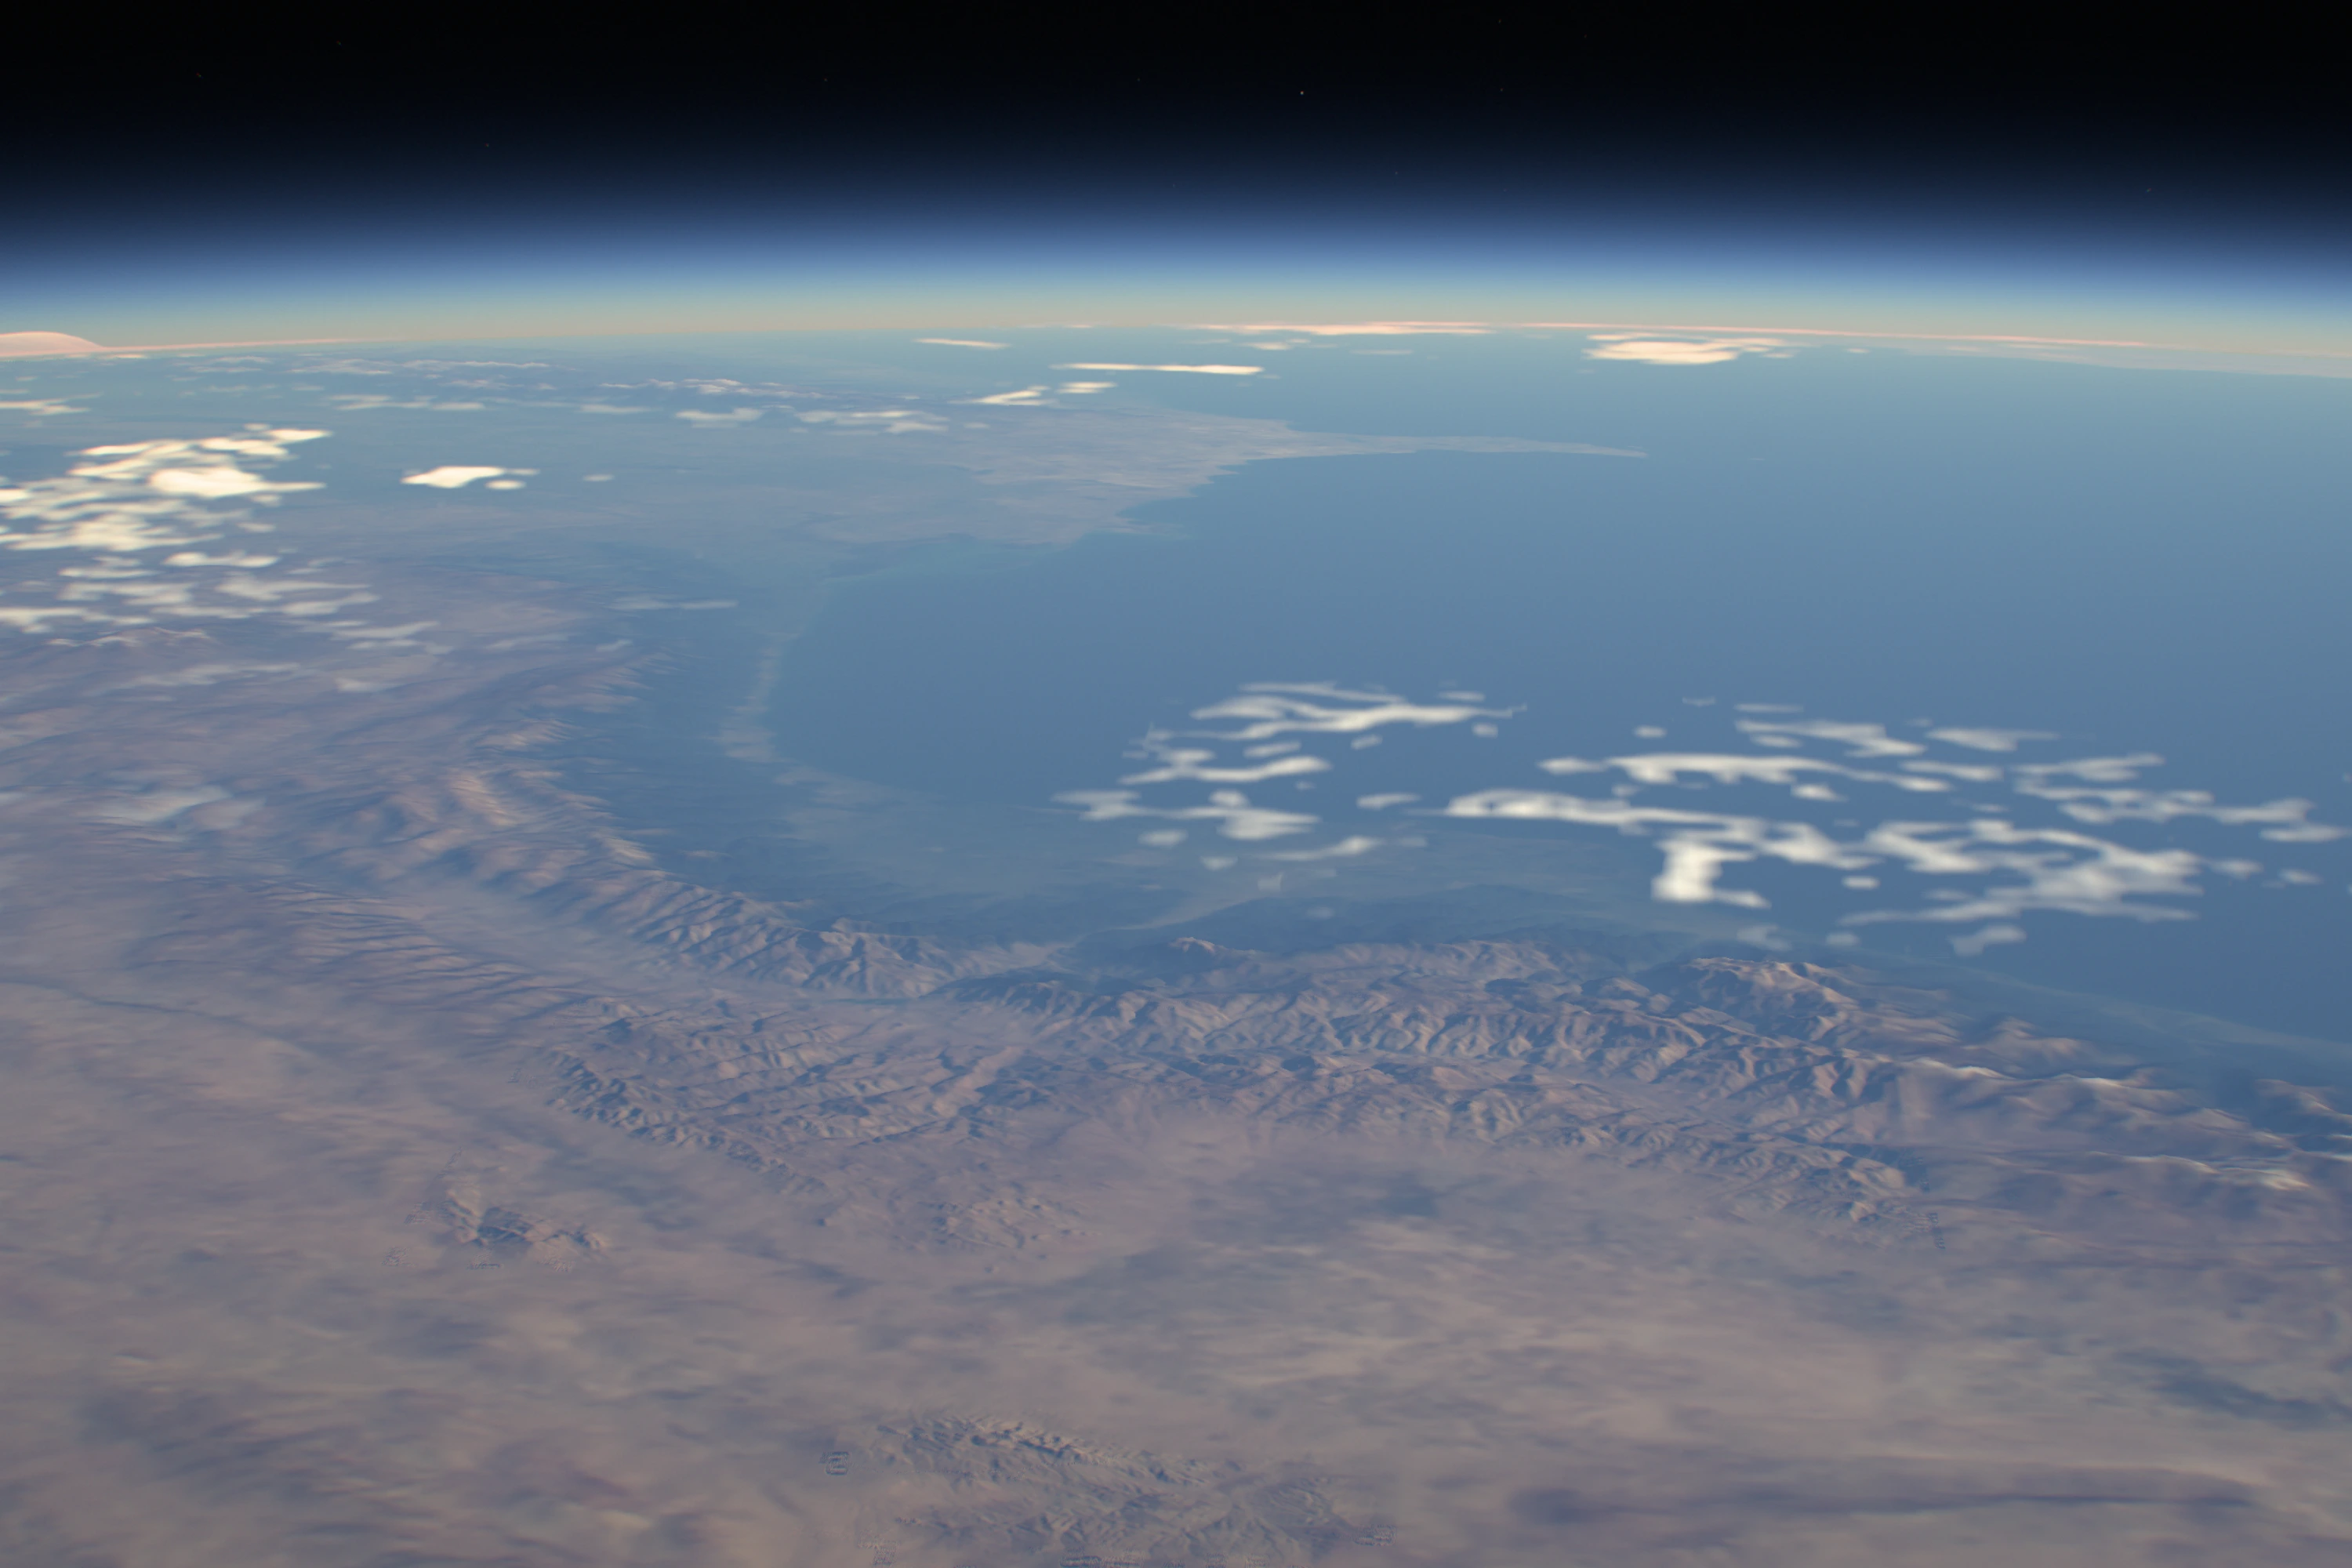
It began at ten past six on a Tuesday evening with a request to Codex for a WebGL background with “some space, stars and a little motion”. It came back with the usual suspects: a particle galaxy, parallax stars, a starfield demo. I turned them all down and sent the picture I actually had in mind, a wallpaper I’d made years earlier from a photograph taken on the ISS.
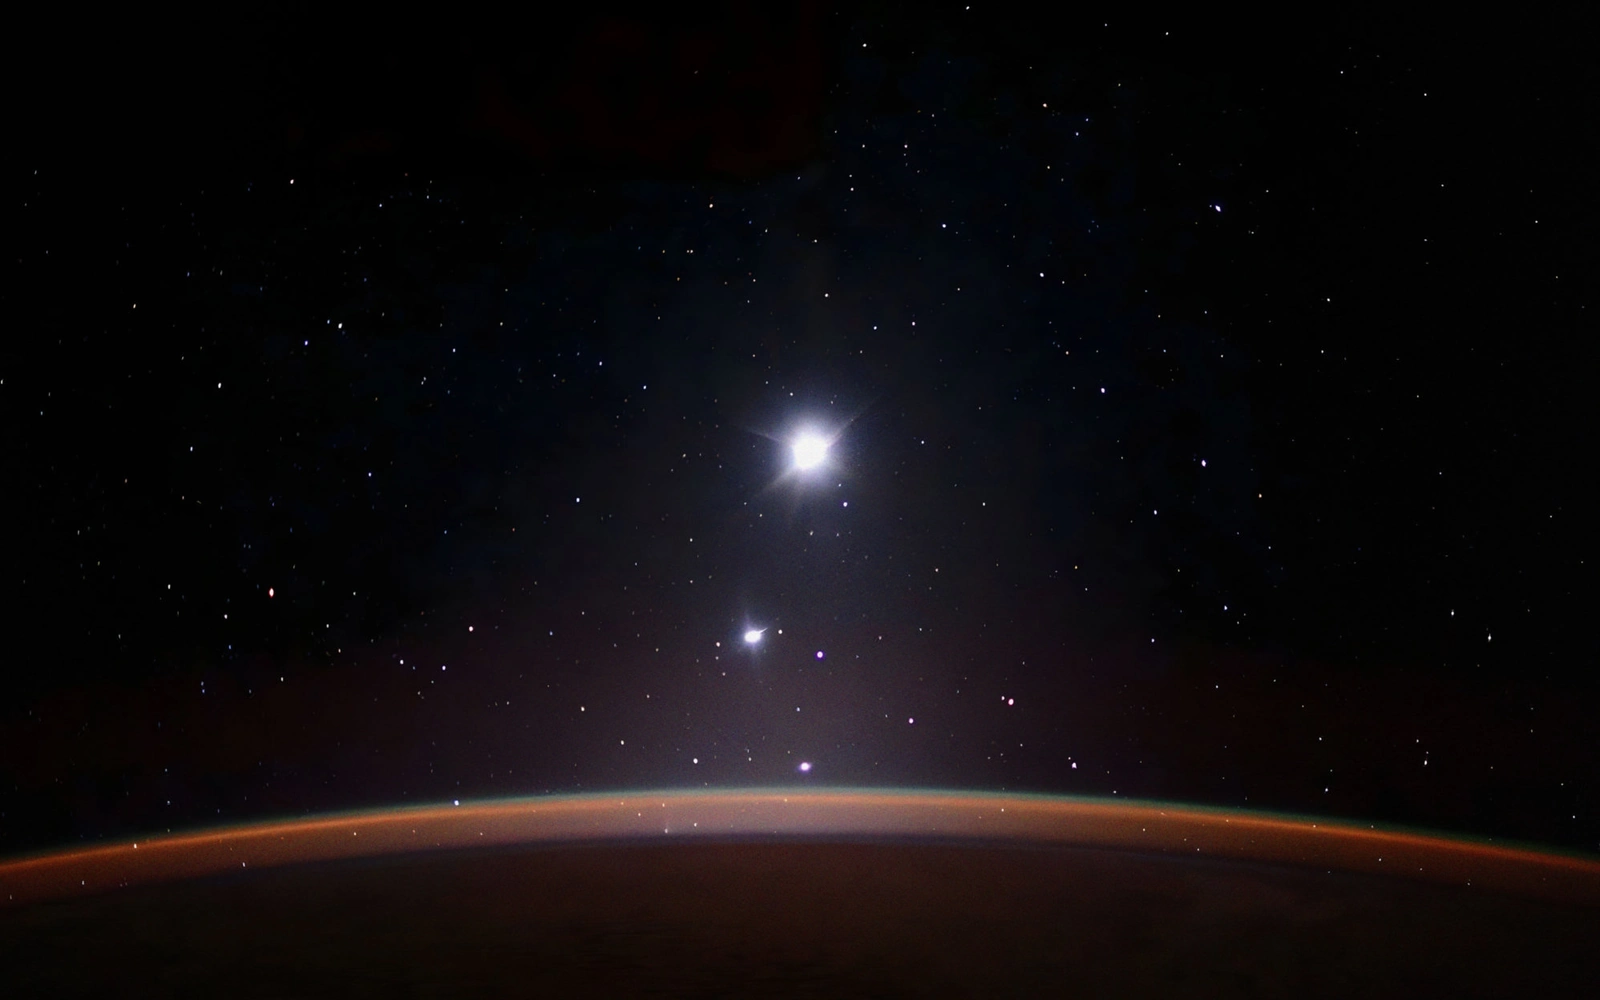
The reference: my wallpaper from an ISS photograph, not a render.
I asked for its character, not a copy: a near-black sky, small sharp stars, the thin glowing horizon, grain, slow motion like a time-lapse. And the bright points had to be whatever they really were, moving the way astronomy says rather than the way that looks nice. That brief already held the whole project. I just didn’t know it yet.
Thirteen minutes later the first version was on screen. Within the hour I wanted more: continents, city lights, clouds, a proper star map, procedural storms. Each addition made sense on its own. Together they turned a picture I loved into a generic space render.
Day one, from the first prototype to the rollback.
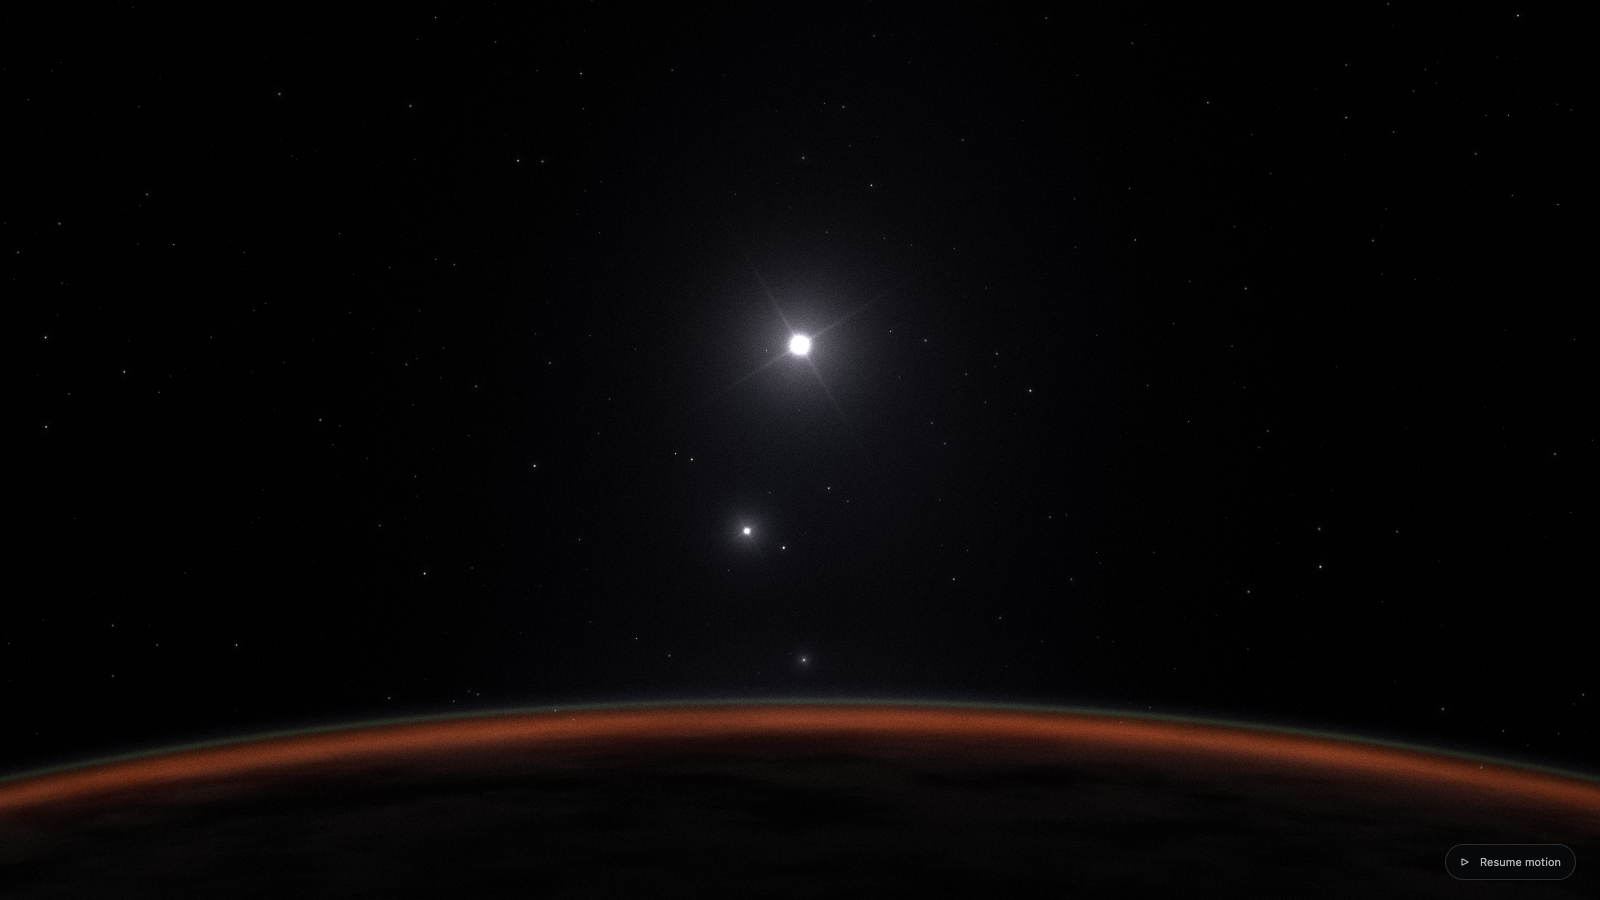
18:29The first prototype. Glowing arc, procedural stars, grain.
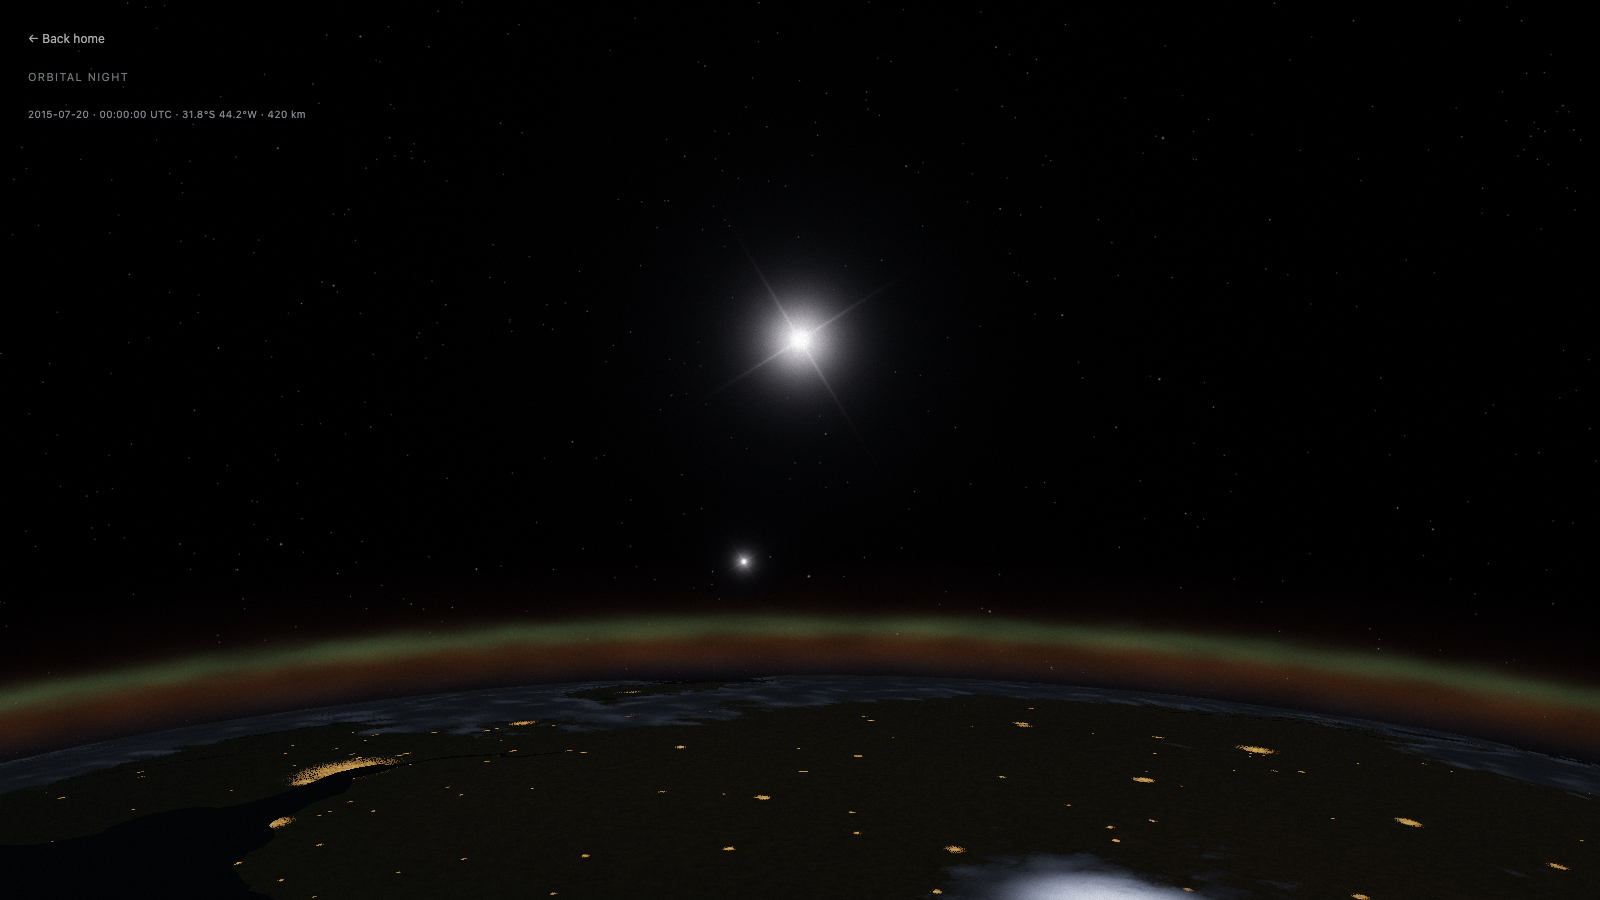
Early eveningAfter an hour of additions. Cities, haze, more of everything. The mood is gone.
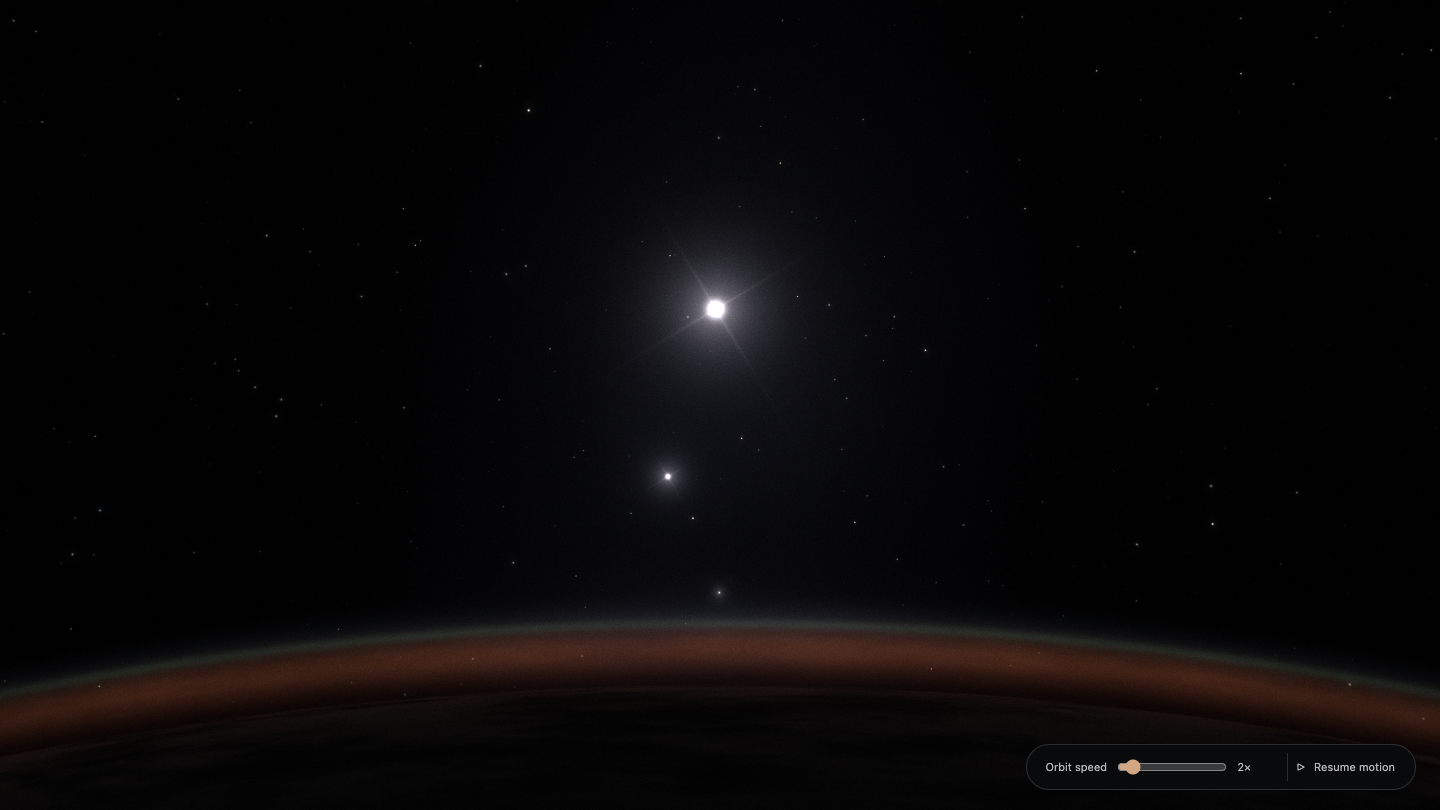
20:50Rolled back to the wallpaper composition.
It came out like crap. It was much better before we started complicating it. Roll back to the view that looked like my wallpaper.
That rollback set the rule for the next two weeks: the wallpaper was the bar, and every new layer had to earn its place against it. Twenty-five minutes later I made the rule harder to keep. The safe plan was to hold the camera over the night side, where darkness hides blurry textures. I asked for the station’s real trajectory instead, through day and night, so the surface had nowhere to hide.
A sky you can check against NASA
The orbit is a saved element set for the ISS, propagated with SGP4: about 93 minutes a lap at roughly 420 km, sixteen sunrises a day. The Sun, Moon and planets come from ephemerides, and the decorative stars made way for the HYG catalog, 15,598 real stars down to magnitude 7.
The correct sky lost to the fake one straight away. The real stars were dimmer and had no rays, and some faint stars still had rays while a brighter one next to them didn’t. The fix wasn’t to paint crosses on chosen stars. Every point of light now passes through the same lens, with its energy set by its catalog magnitude, so a star’s rays follow from how bright it is.
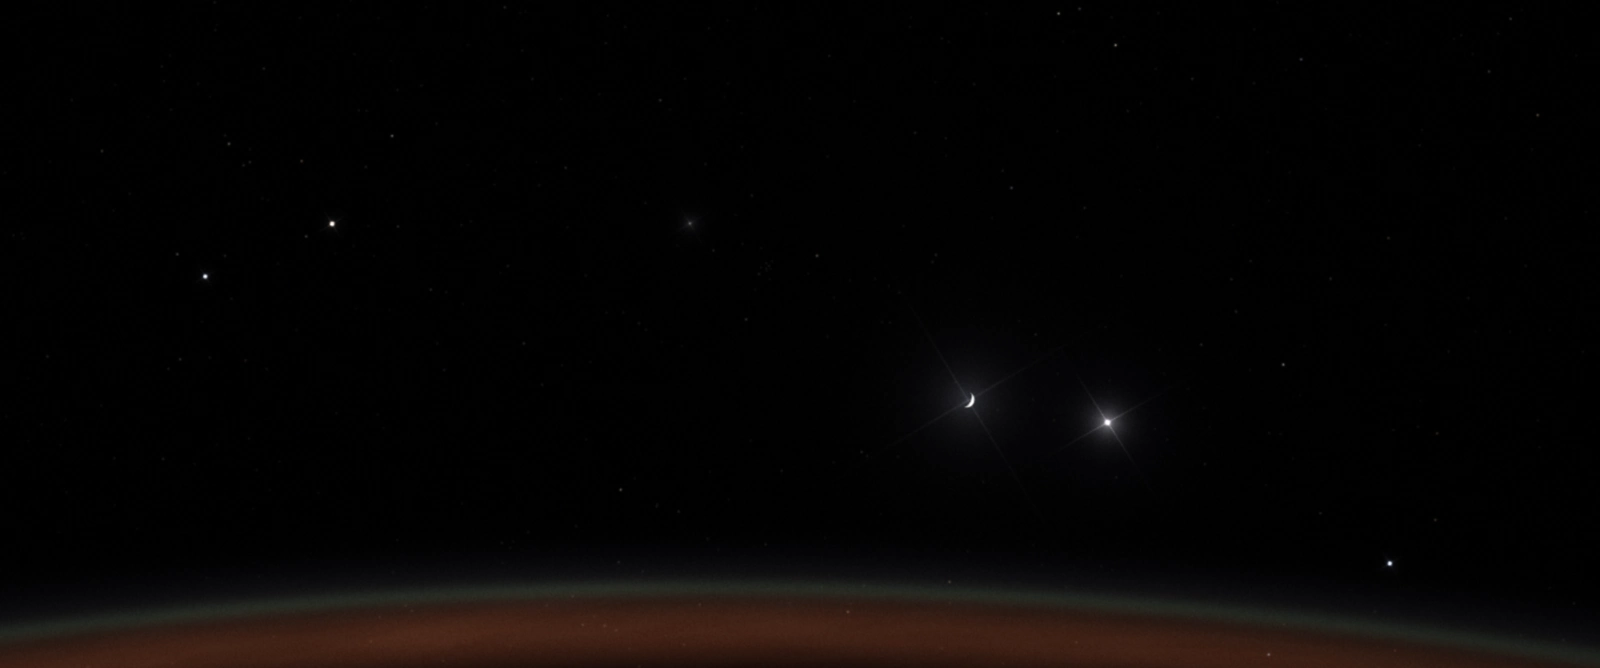
Rays on the Moon and Jupiter, but not on other bright stars.
Then I noticed that NASA publishes star maps and suggested checking our sky against them. For 500 isolated bright stars, positions matched to a median of 1.35 arcminutes, about half a pixel of NASA’s map. Brightness didn’t match: the map compresses the range between bright and faint stars. So we kept the catalog’s magnitudes instead of tuning them to a prettier picture. One source can be good evidence for one property and wrong about another.
The Milky Way took more versions than anything else in the sky. The first was procedural, with invented dust (“That’s not the Milky Way, that’s some junk you drew”). NASA’s map replaced it, and then showed how easily data goes wrong in a renderer: at 8K it came out darker than at 4K, because the same light was spread over four times as many pixels.
Under the hoodThe sky in numbers
- Stars. HYG v4.1, 15,598 stars to V = 7. J2000 positions with proper motion, colour from the B−V index, flux from magnitude by Pogson’s law.
- NASA check. 500 stars brighter than V = 4 and more than 0.6° from their neighbours. Median position offset 1.35′, 95th percentile 2.76′, against a map pixel of about 2.64′. The measured brightness slope was about half the catalog’s.
- Not thinned. Dropping stars fainter than V = 6.5 would have saved about 190 KB gzipped and removed hundreds of visible points. We kept them.
- Sharp points. Each star puts 96% of its energy into a compact core integrated over the pixel and 4% into optical wings, so sub-pixel motion doesn’t shimmer.
- Milky Way. NASA’s Deep Star Maps 2020, without bright foreground stars, in galactic coordinates. At 8K it needed ×4 linear scaling, at 16K ×16. Detail streams in 512 px tiles, up to 17 on desktop and 7 on mobile, on top of a 4K overview. I picked AVIF at quality 50 over the recommended 65: 3.76 MB instead of a 13.46 MB JPEG.
- The seam. A dark diagonal line across the sky was a filtering bug: at the panorama’s seam the texture coordinate wraps around, and the derivatives picked the coarsest mipmap.
One camera and one light meter for every light
The most important decision in the project was that no object gets its own brightness. It came from the first time I turned the camera toward the Sun, and the scene fell apart.
The Sun on 7 October, before the camera was rebuilt.
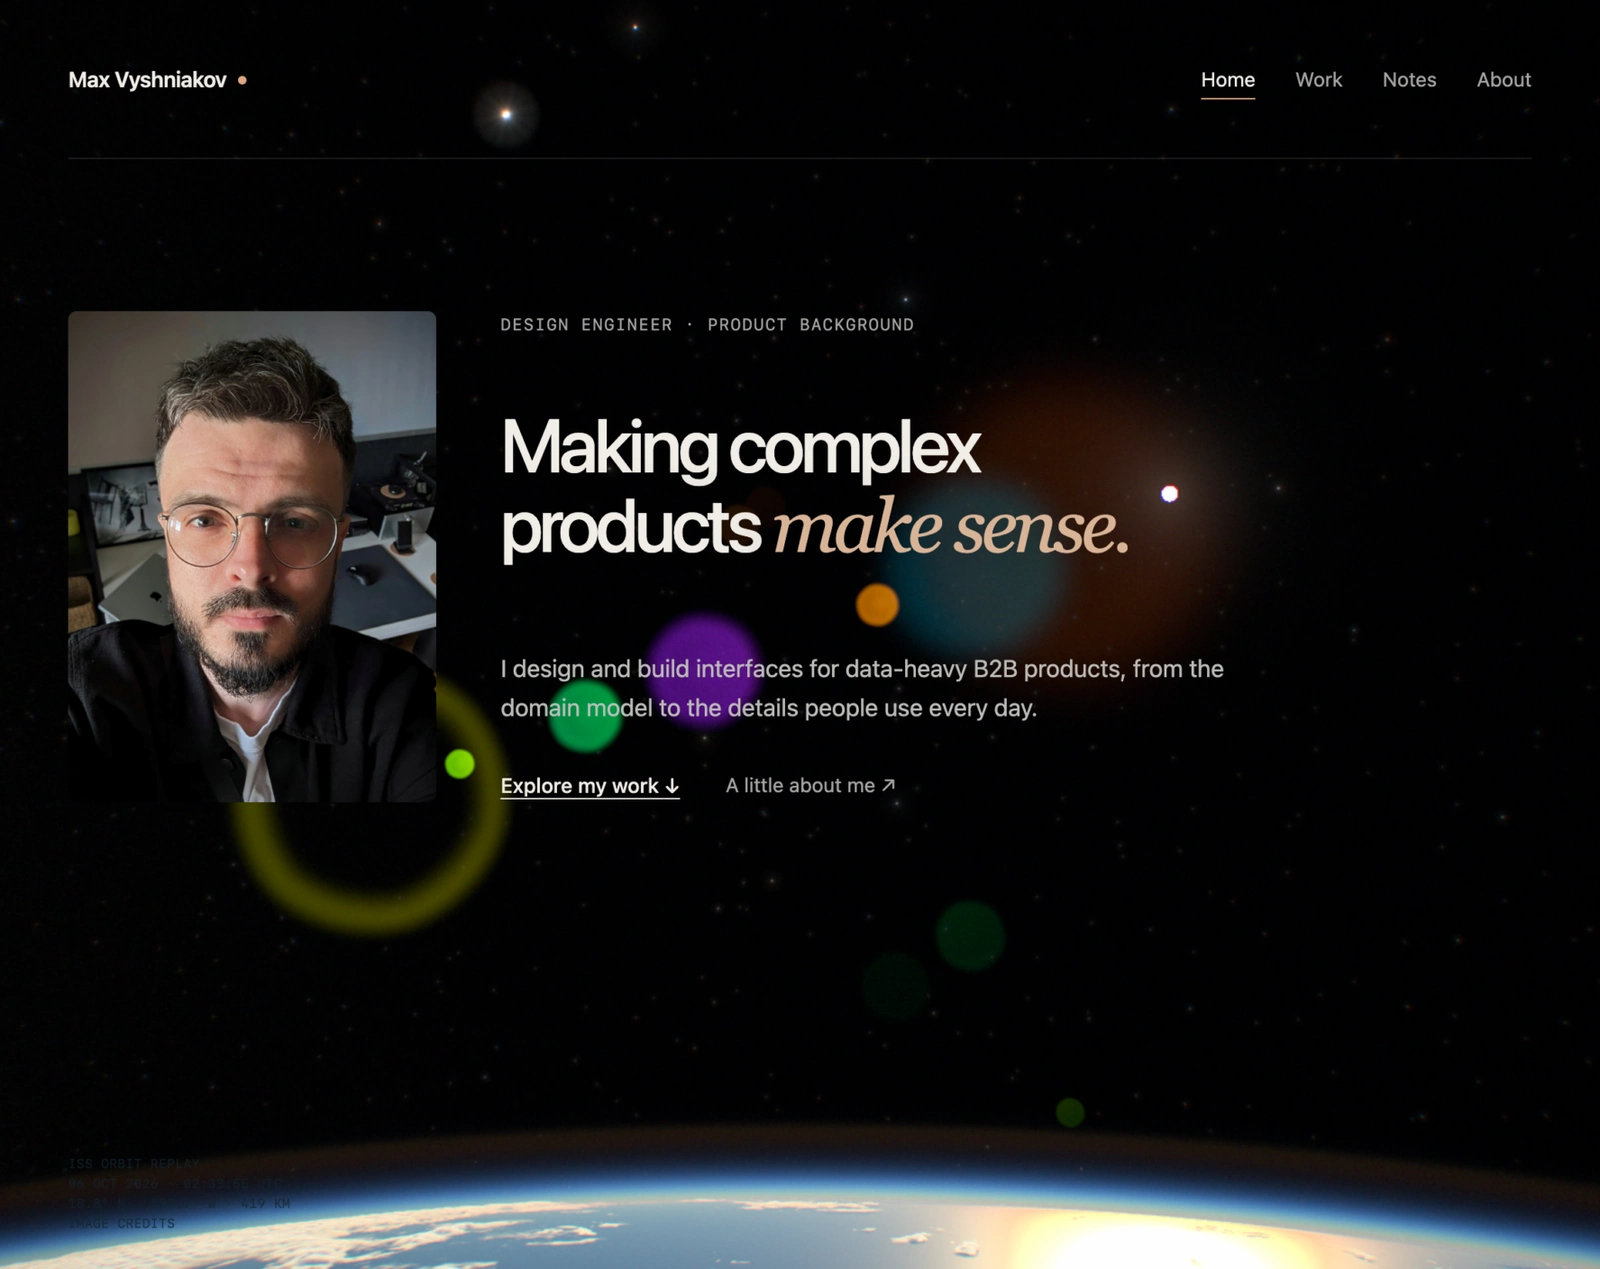
First look at the Sun
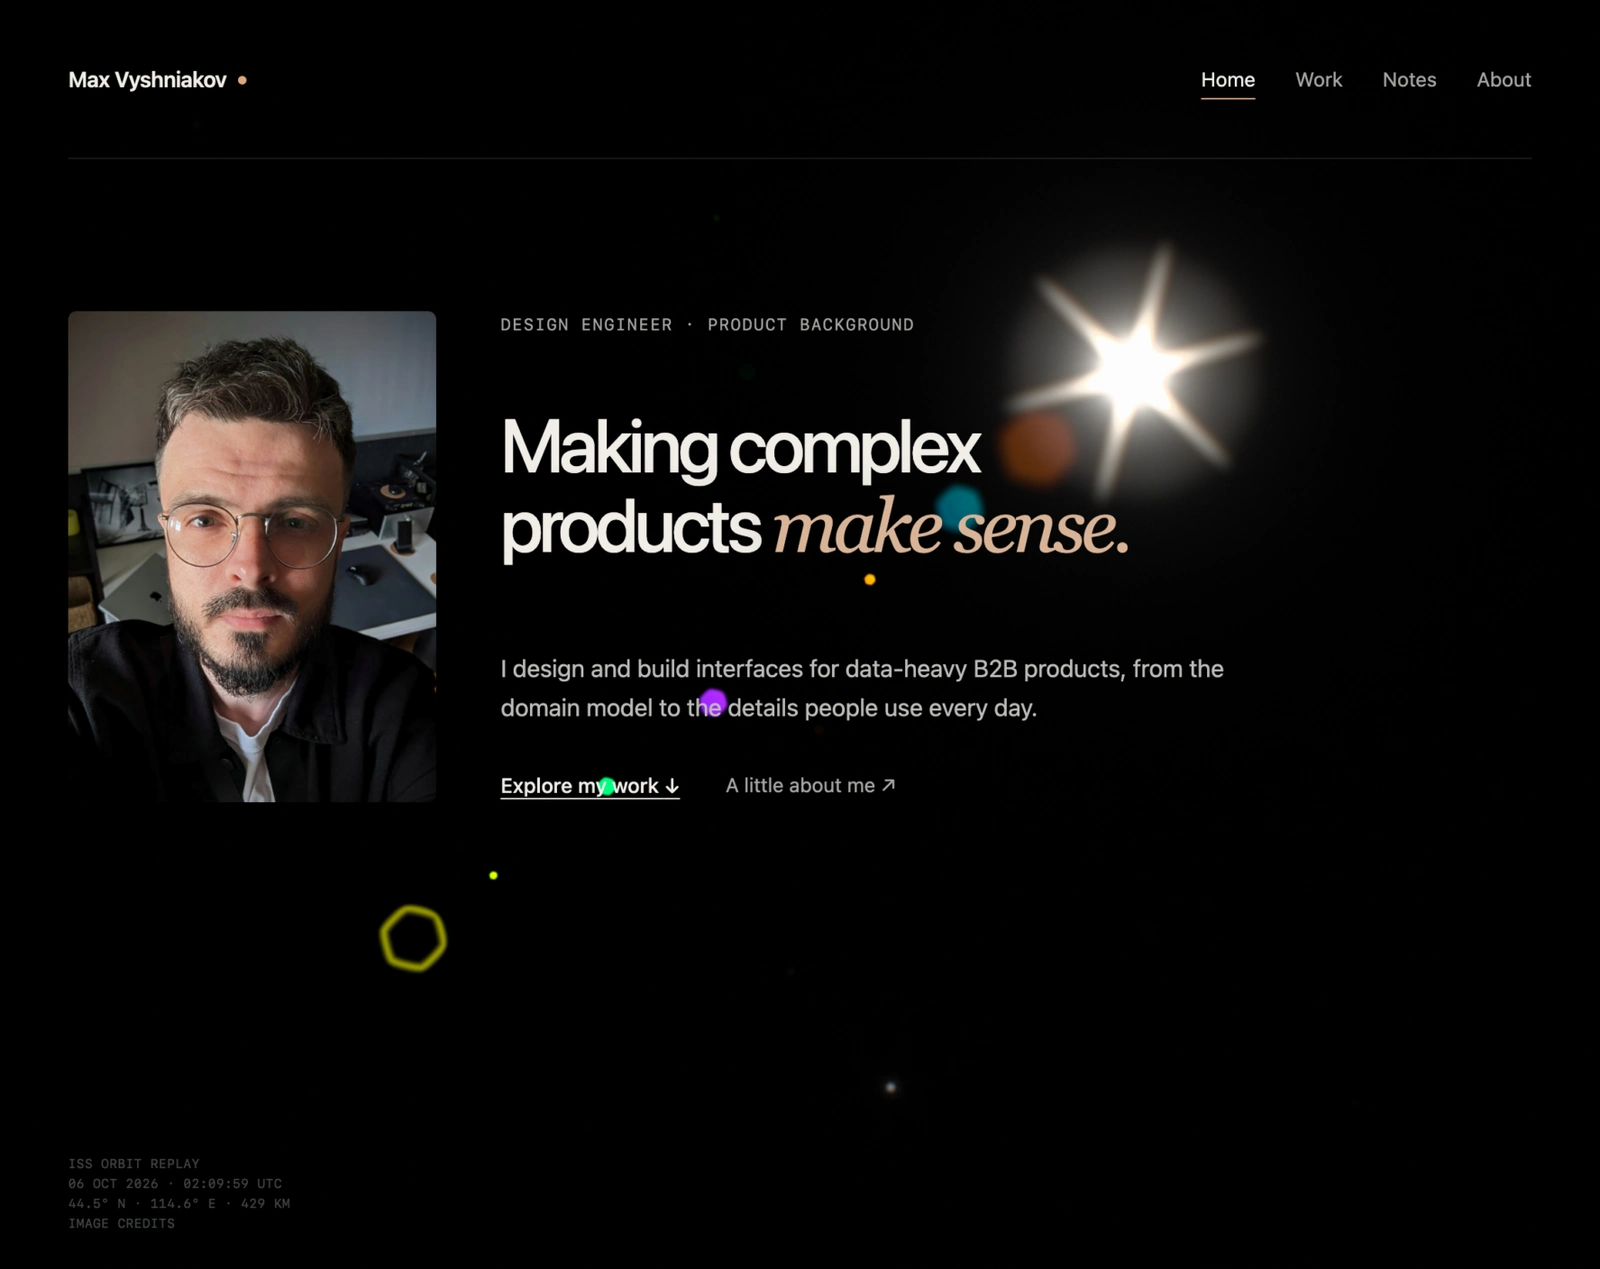
“Circles of coloured paper”
The Sun was a small dim dot with enormous lens reflections, and the stars didn’t react to it at all. I couldn’t say what was wrong technically, only what a real frame would look like: “The Sun should be insanely bright. The stars should fade, or there should be a hell of a halo around it. That’s what my intuition says.” The cause was that every bright thing had its own setting. The light meter sampled 64 points and the solar disc could fall between them, and the reflections had their own boost. Nothing in the system knew that the huge reflections and the tiny dot were the same light.
So instead of a better flare we built a camera, where one source of light drives everything you see.
- Light
Sun, Moon, planets, 15,598 stars, cities, airglow, aurora, lightning
- Air and clouds
Scattering, extinction and shadows, all in linear light
- LensDiffraction rays, internal reflections, aberrations, defocus
- Sensor
Photons to electrons, shot and read noise, ISO, highlights, Display P3
A light meter reads the image on the GPU and sets the aperture and ISO. Those settings change the lens’s rays and reflections and the sensor’s noise.
I couldn’t have written the optics, and said so on the first evening: “I don’t know the physical camera model with all these aberrations. You know better.” What I could do was describe exactly what looked wrong until the model stopped producing it.
The light meter had to learn the same lesson, and I was part of the problem. On 10 October I noticed that the Milky Way above the horizon got brighter when I looked down at the Earth. “Do we have some hacky correction somewhere?” We did. Ten minutes earlier I’d made my favourite +2 EV the default, and the meter had also learned to add a stop whenever the Earth was in frame. Each tweak improved one view by knowing what was in it. Together they made the sky change brightness depending on where you looked.
Do it. Without my +2. Maybe we won’t need them.
The new meter looks at light, not at objects. It reads 1,024 points into a brightness histogram, ignores the darkest 10% and the brightest 2% and aims for a mid-grey. It has no idea what the Earth or an aurora is, so the same light always gets the same answer.
Under the hoodThe camera in numbers
- Program. Shutter fixed at 1/48 s, the film rule for 24 frames per second; auto exposure moves aperture and ISO. The base is f/4 at ISO 400; brightening, the aperture opens to about f/3.2, then ISO rises to about 3,000; darkening, the iris closes to f/16 at ISO 100.
- Lens. Star rays come from the aperture’s shape, its Fourier transform summed over 420–680 nm. The iris stops just short of round, because a perfectly round one killed the rays: a taste decision, documented as one. Seven reflection elements each carry about 0.2% of their source’s real light.
- Meter. 1,024 GPU samples with a soft centre weight, a 24-bin log-luminance histogram and a trimmed log mean, with a guard for large coloured highlights such as aurora curtains. A bright spike has to last 120 ms before the camera reacts, so lightning doesn’t dim the night. Adaptation takes about 1.25 s to brighten and 0.4 s to darken, with its state on the GPU so the CPU never waits.
- Sensor. Light becomes photoelectrons before ISO: 36,000 electrons at white, shot and read noise, full-well clipping and a highlight shoulder. A dark frame is noisier than a bright one for a physical reason, not because grain was turned up.
- Night light. A gamma-2.2 encode followed by an sRGB decode once lifted the faintest values about 41 times and made the night side glow with no source. Everything now stays linear until one encode at the very end, in Display P3 where the screen supports it.
The aurora took eight rounds of notes
No part of the scene took more criticism. Codex found Lawlor and Genetti’s paper on volume-rendering auroras on the GPU; I found Seán Doran’s ISS – Light Of Aurora, processed station footage with exactly the look we were after. Then I compared the two, round after round.
The aurora in eight rounds, 7 to 10 October.
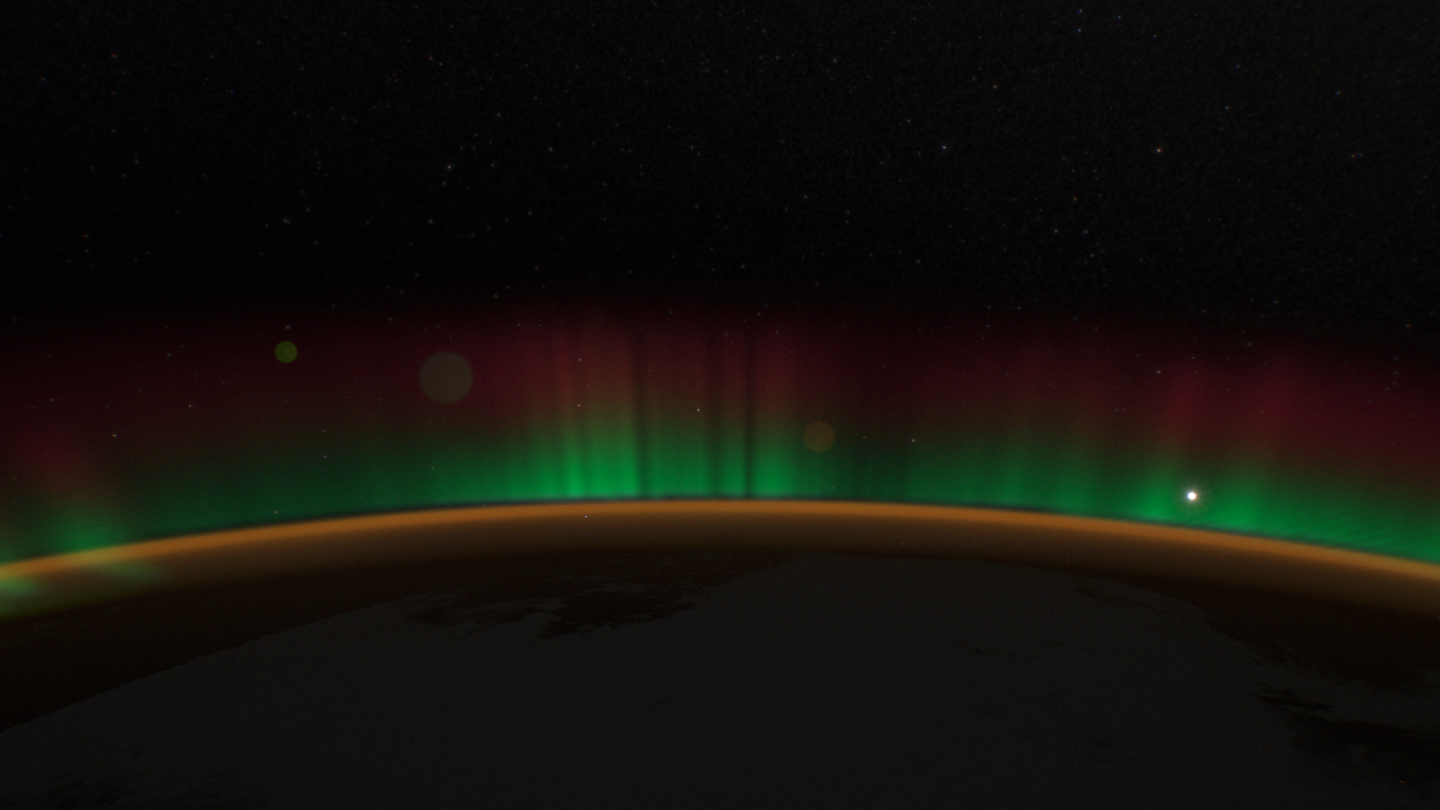
7 Oct, v1An even green band and red haze.
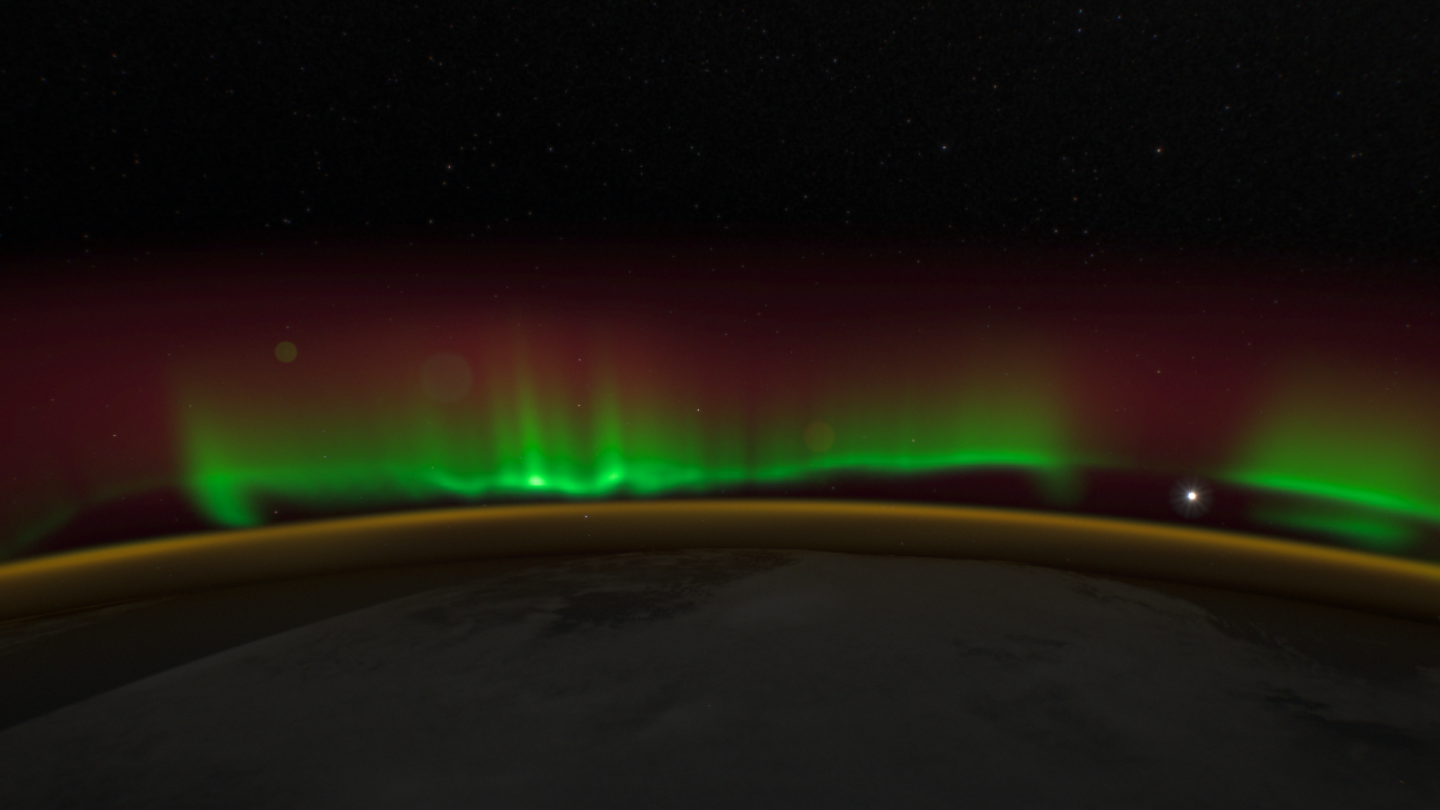
7 OctTuned to the video: separate folds.
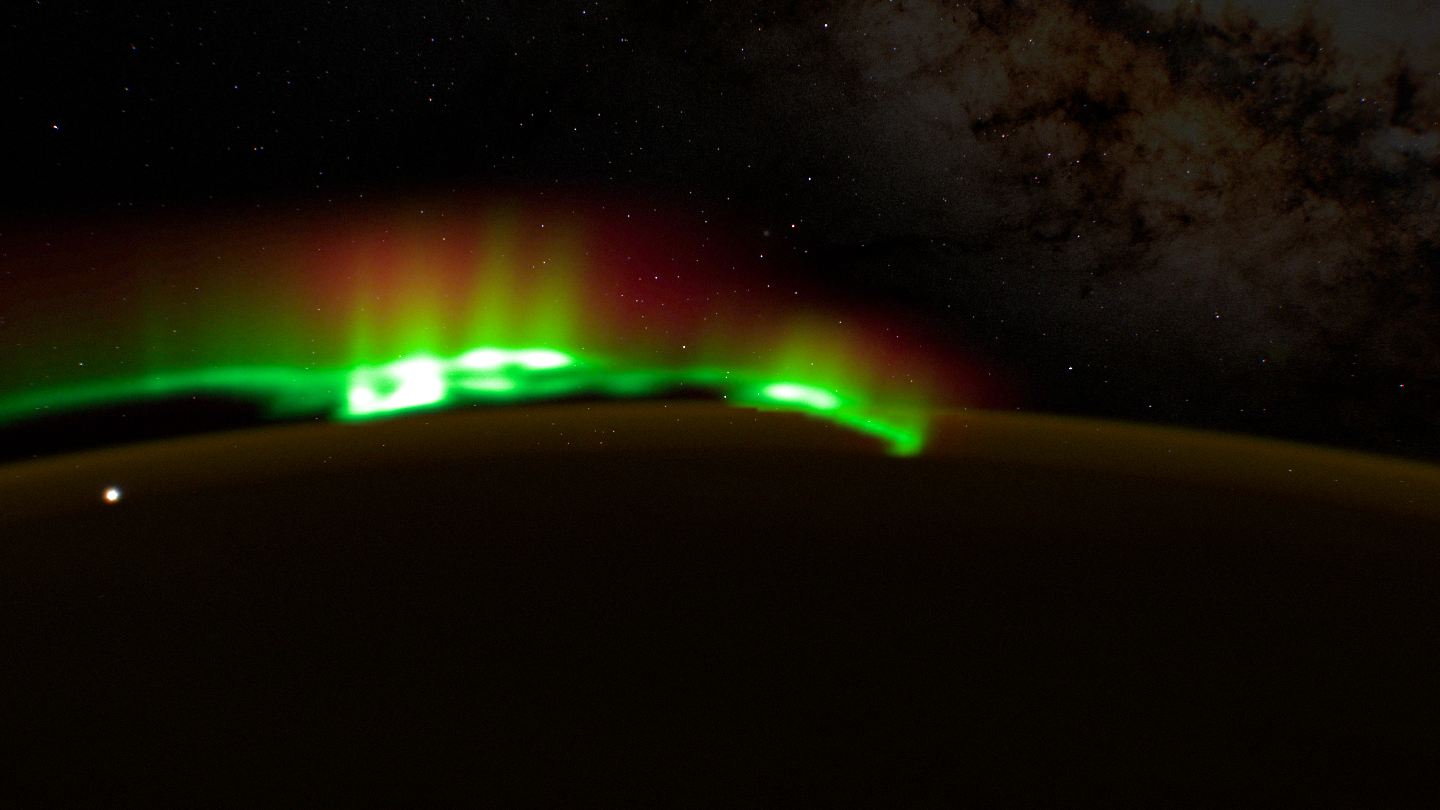
10 Oct, nightBefore the rework: thick, soft, clumpy.
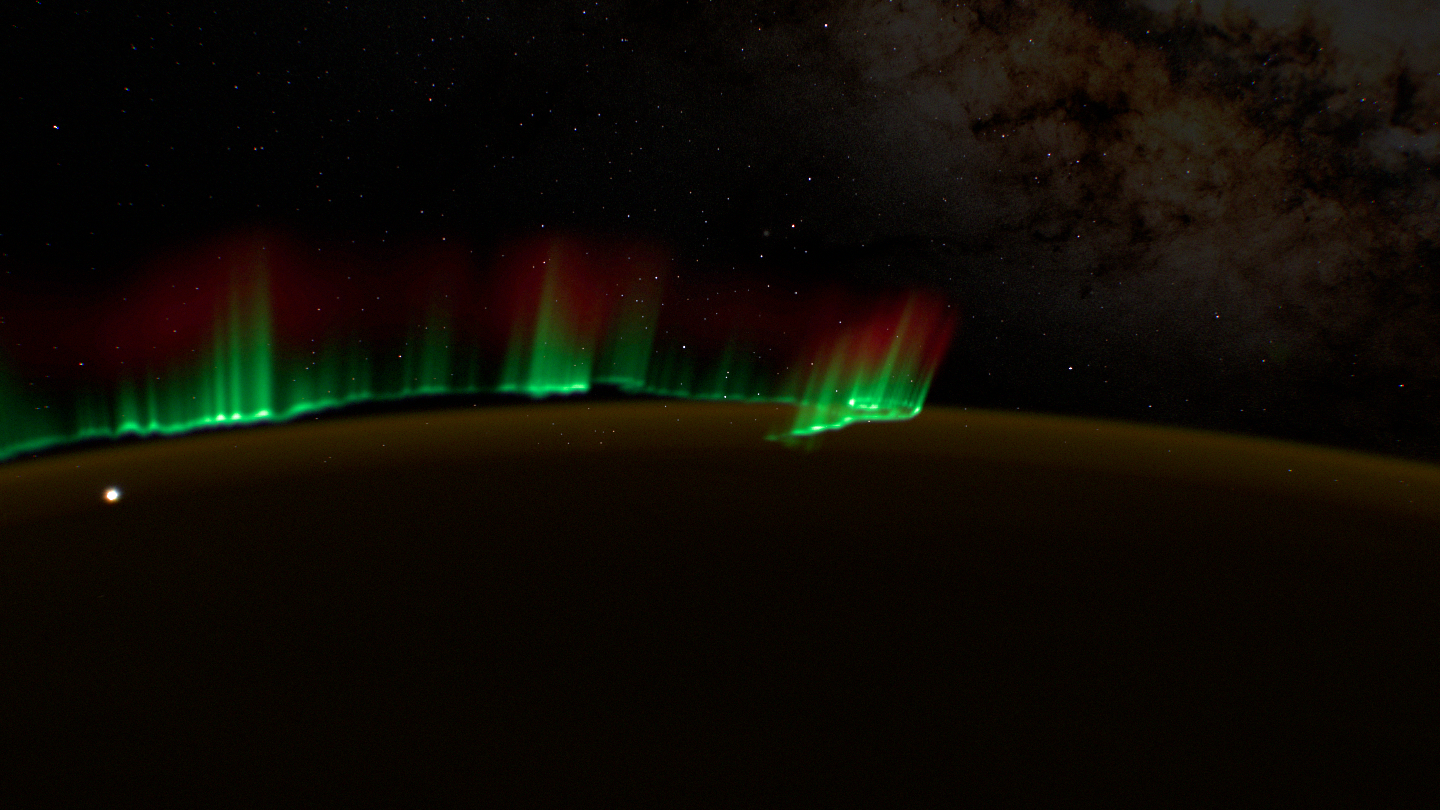
RaysThin rays and folds.
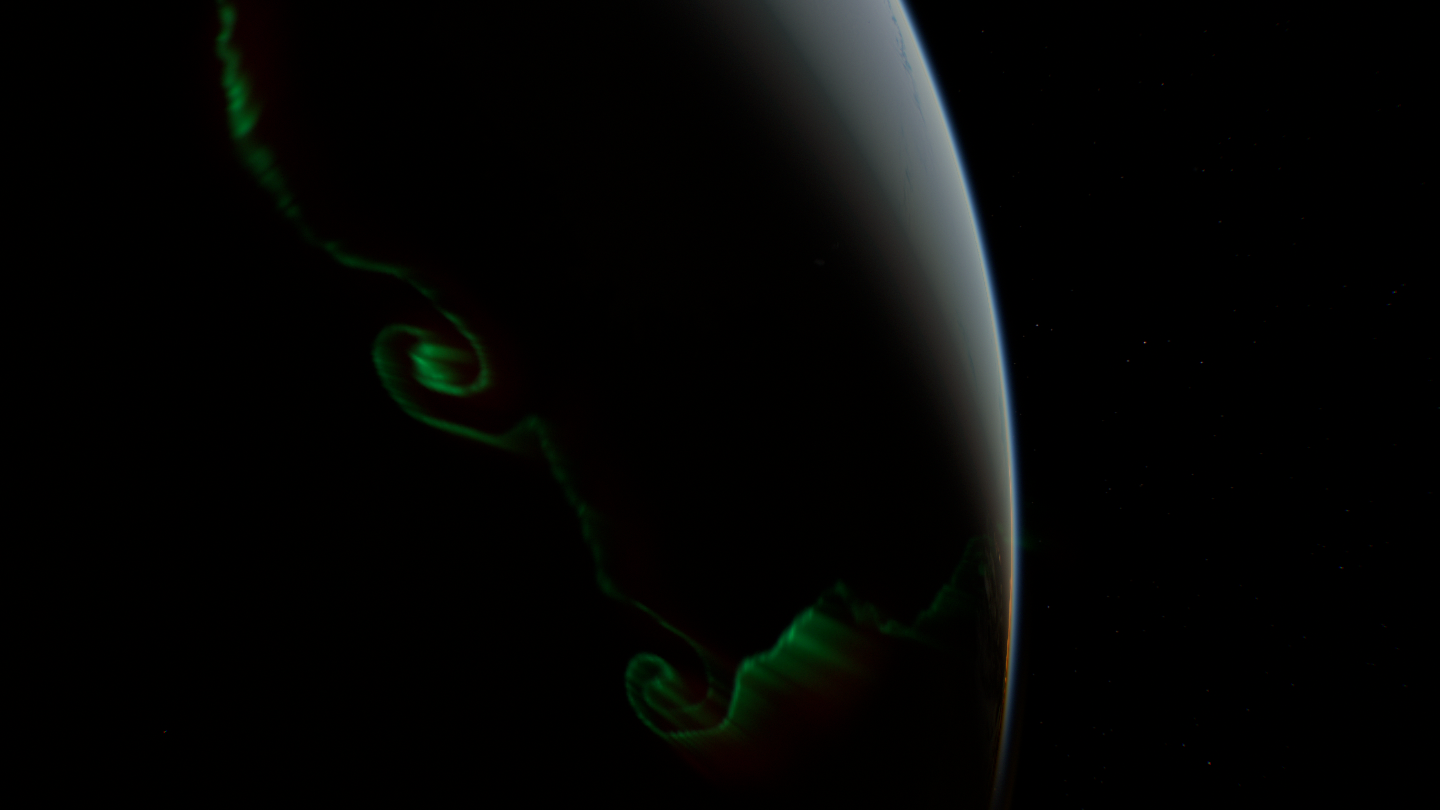
From above“The body is gone.”
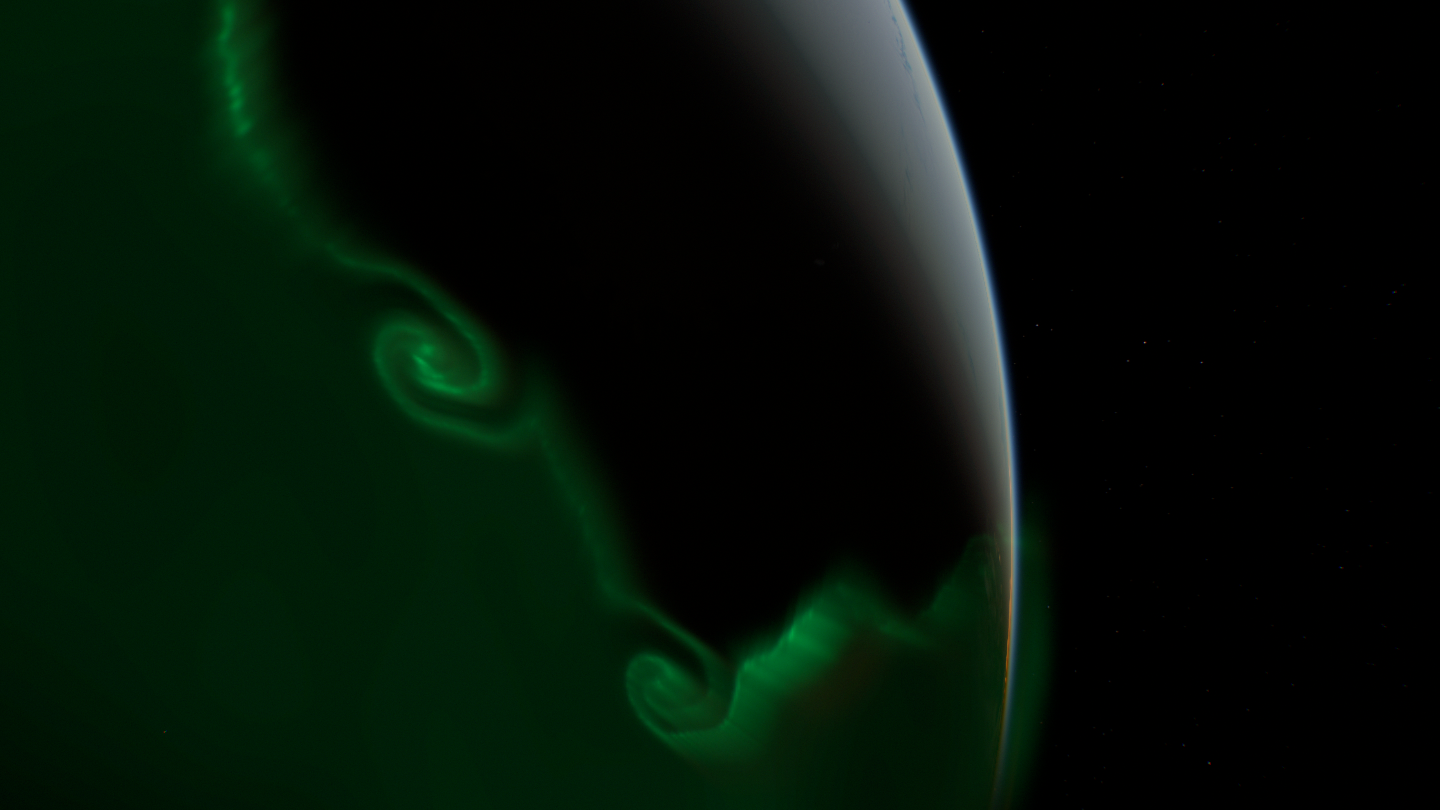
GlowThe diffuse glow is back. So are two obvious spirals.
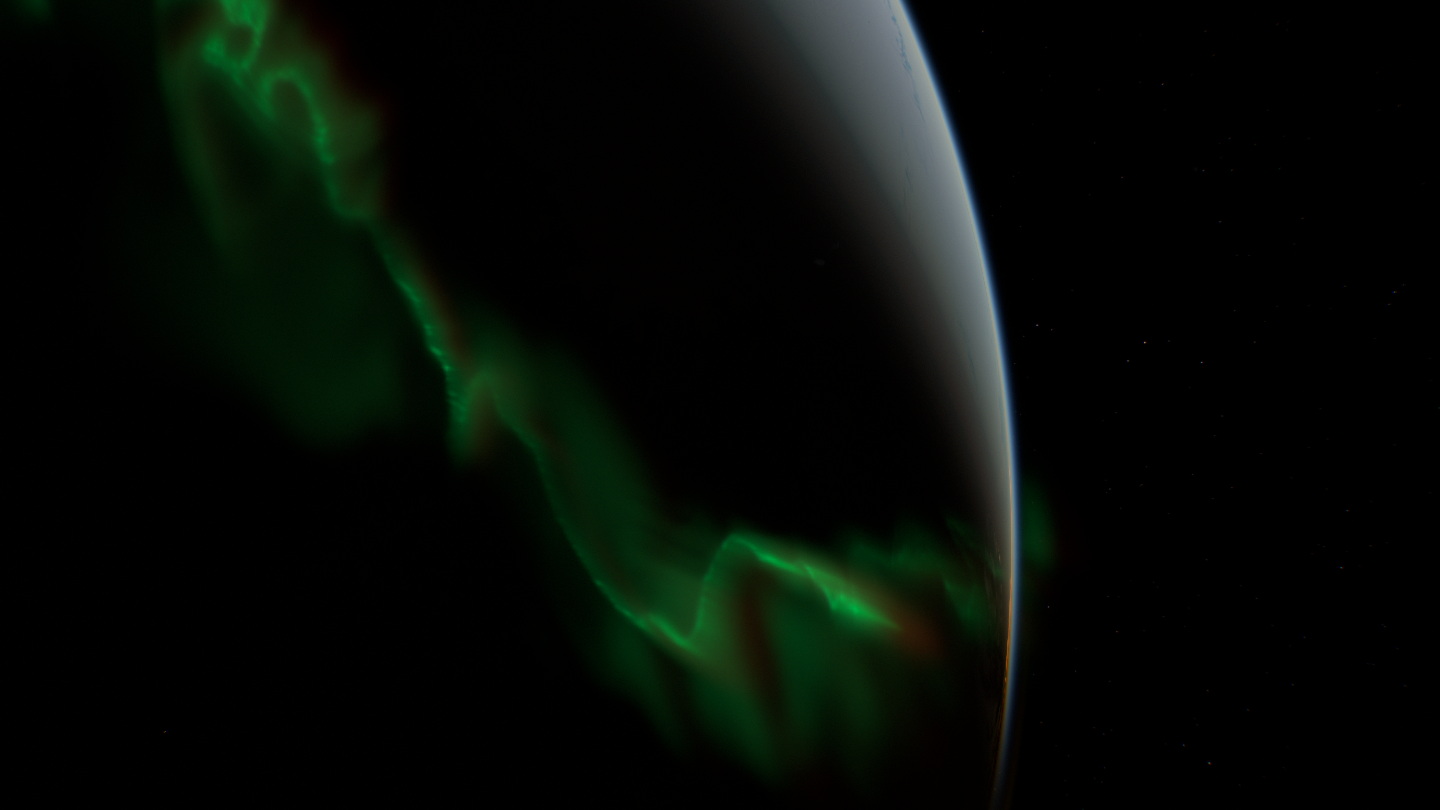
StructureIrregular folds, smooth gradients.
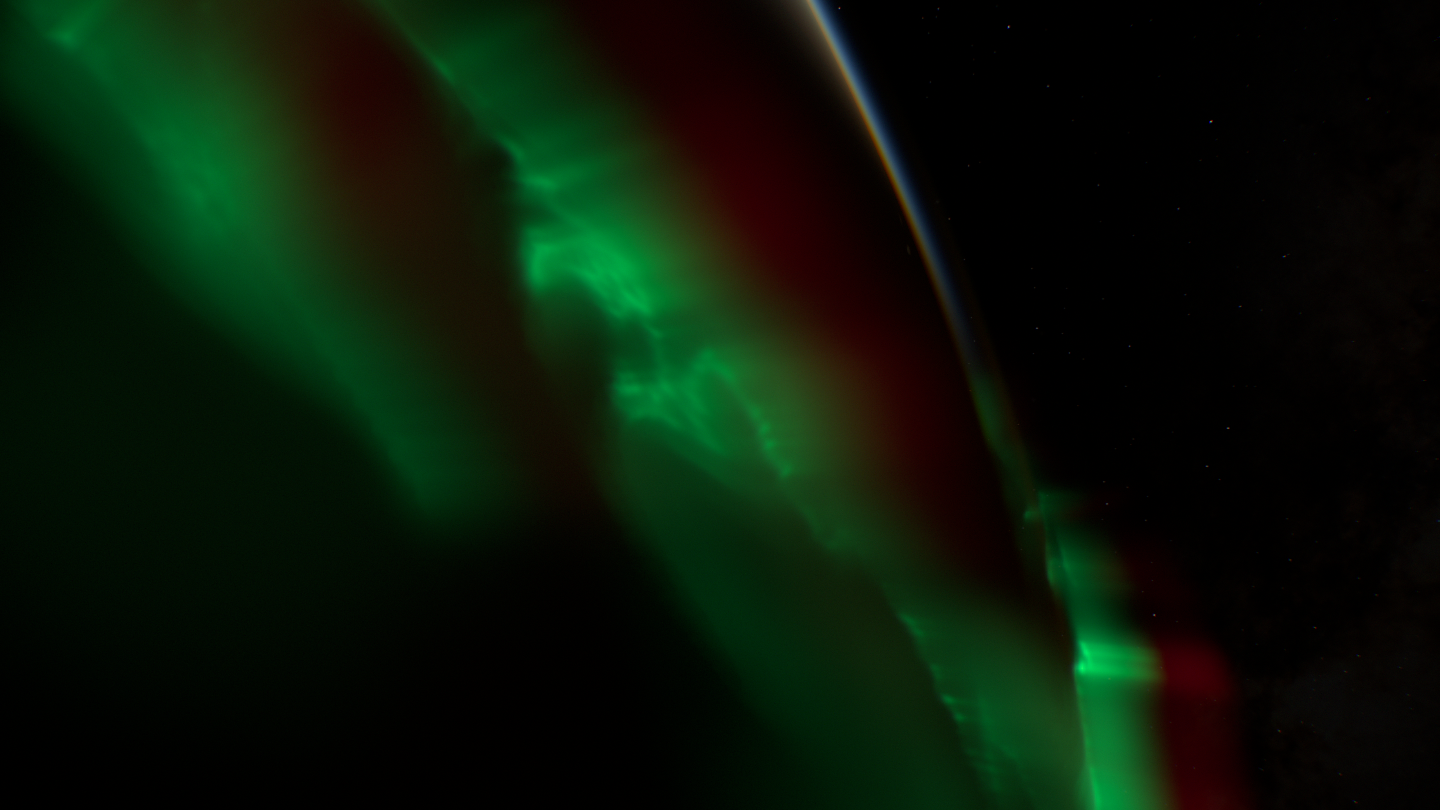
RedThe red upper layer tuned separately.
My notes, in order, and what each one turned out to mean:
- “The base starts at one height, as if it’s glued to an invisible sphere.” The lower edge needed real variation in height.
- “Now it’s all chaotic. In reality the chaos isn’t everywhere.” Smooth stretches and swirls had to alternate.
- “Too concentric, like a cap.” Seen from further out in free flight, the oval was too regular.
- “Now there are only these squiggles left. The body is gone.” This one wasn’t about the rays at all. The footage had a broad translucent glow between the bright curtains, the difference between discrete and diffuse aurora, and we had none.
- “It’s way too obvious you just stuck two spirals in there.” The oval had been split into cells with the same twist.
- “There’s not enough red now.”
Two lessons ran under all of it. A still frame proves nothing about motion: an aurora that passed a time-lapse test showed moiré as soon as I flew the camera through it. And cost is part of the look. The first volume took about 24 ms of GPU time per frame; precomputing the curtain shapes and integrating only near the visible pole brought the same view to about 6 ms, which is what made the detailed version affordable.
Under the hoodThe aurora that shipped
- The oval follows the WMM2025 magnetic dipole and widens toward magnetic midnight.
- A 2048 × 1024 footprint covers both hemispheres, with a cross-track step of about 7 km instead of 27 km. Its channels hold thin rays, the curtain body, the height of the lower edge and the diffuse glow.
- Emission lives between 85 and 420 km. The green lower edge varies between about 99 and 137 km; the red peak sits at 245–330 km.
- 128 intervals per ray, with 8 extra samples only inside the bright curtains. The broad diffuse glow is integrated more cheaply.
- Half-float storage holds 12,224 distinct levels of green in the test fixture, so exposure can lift faint light without visible steps.
- No frame history or random jitter, so pausing and seeking always give the same picture.
- It’s an illustration built on a real magnetic model, not a forecast or a simulation of the magnetosphere.
Clouds and cities come from data, not invention
Every part of the Earth went through the same loop: I described what looked wrong in plain words, we found references, and the cause was usually a shape we had invented on top of the data.
The clouds come from NASA’s cloud-cover composite, lifted into a volume. A photo of cloud cover says nothing about height, so the volume kept guessing, and my notes read like a catalogue of failures: “like spikes”, “smoothed flat like putty”, “a pile of snow on an invisible sphere”, “very holey cheese”. In the second week it was “a drop of kefir on snow” and “a pixel pattern on a military uniform”. Both times the cause was the same: a coarse mask that formed a smooth lid over the clouds, and gaps cut on a regular noise grid. Now the tops and the gaps both come from NASA’s map, noise only shapes the relief, and GPU time fell 22–28% in the bargain.
The density was settled by a measurement rather than by taste. After I’d rejected a thinned preset (“Way too few now, and all of them dense cumulus”), Claude fitted cloud opacity to NASA’s own composite of the same plates, to within 0.011 RMS over dark ocean. I compared them and wrote back: “Calibrated, we’ll take it.”
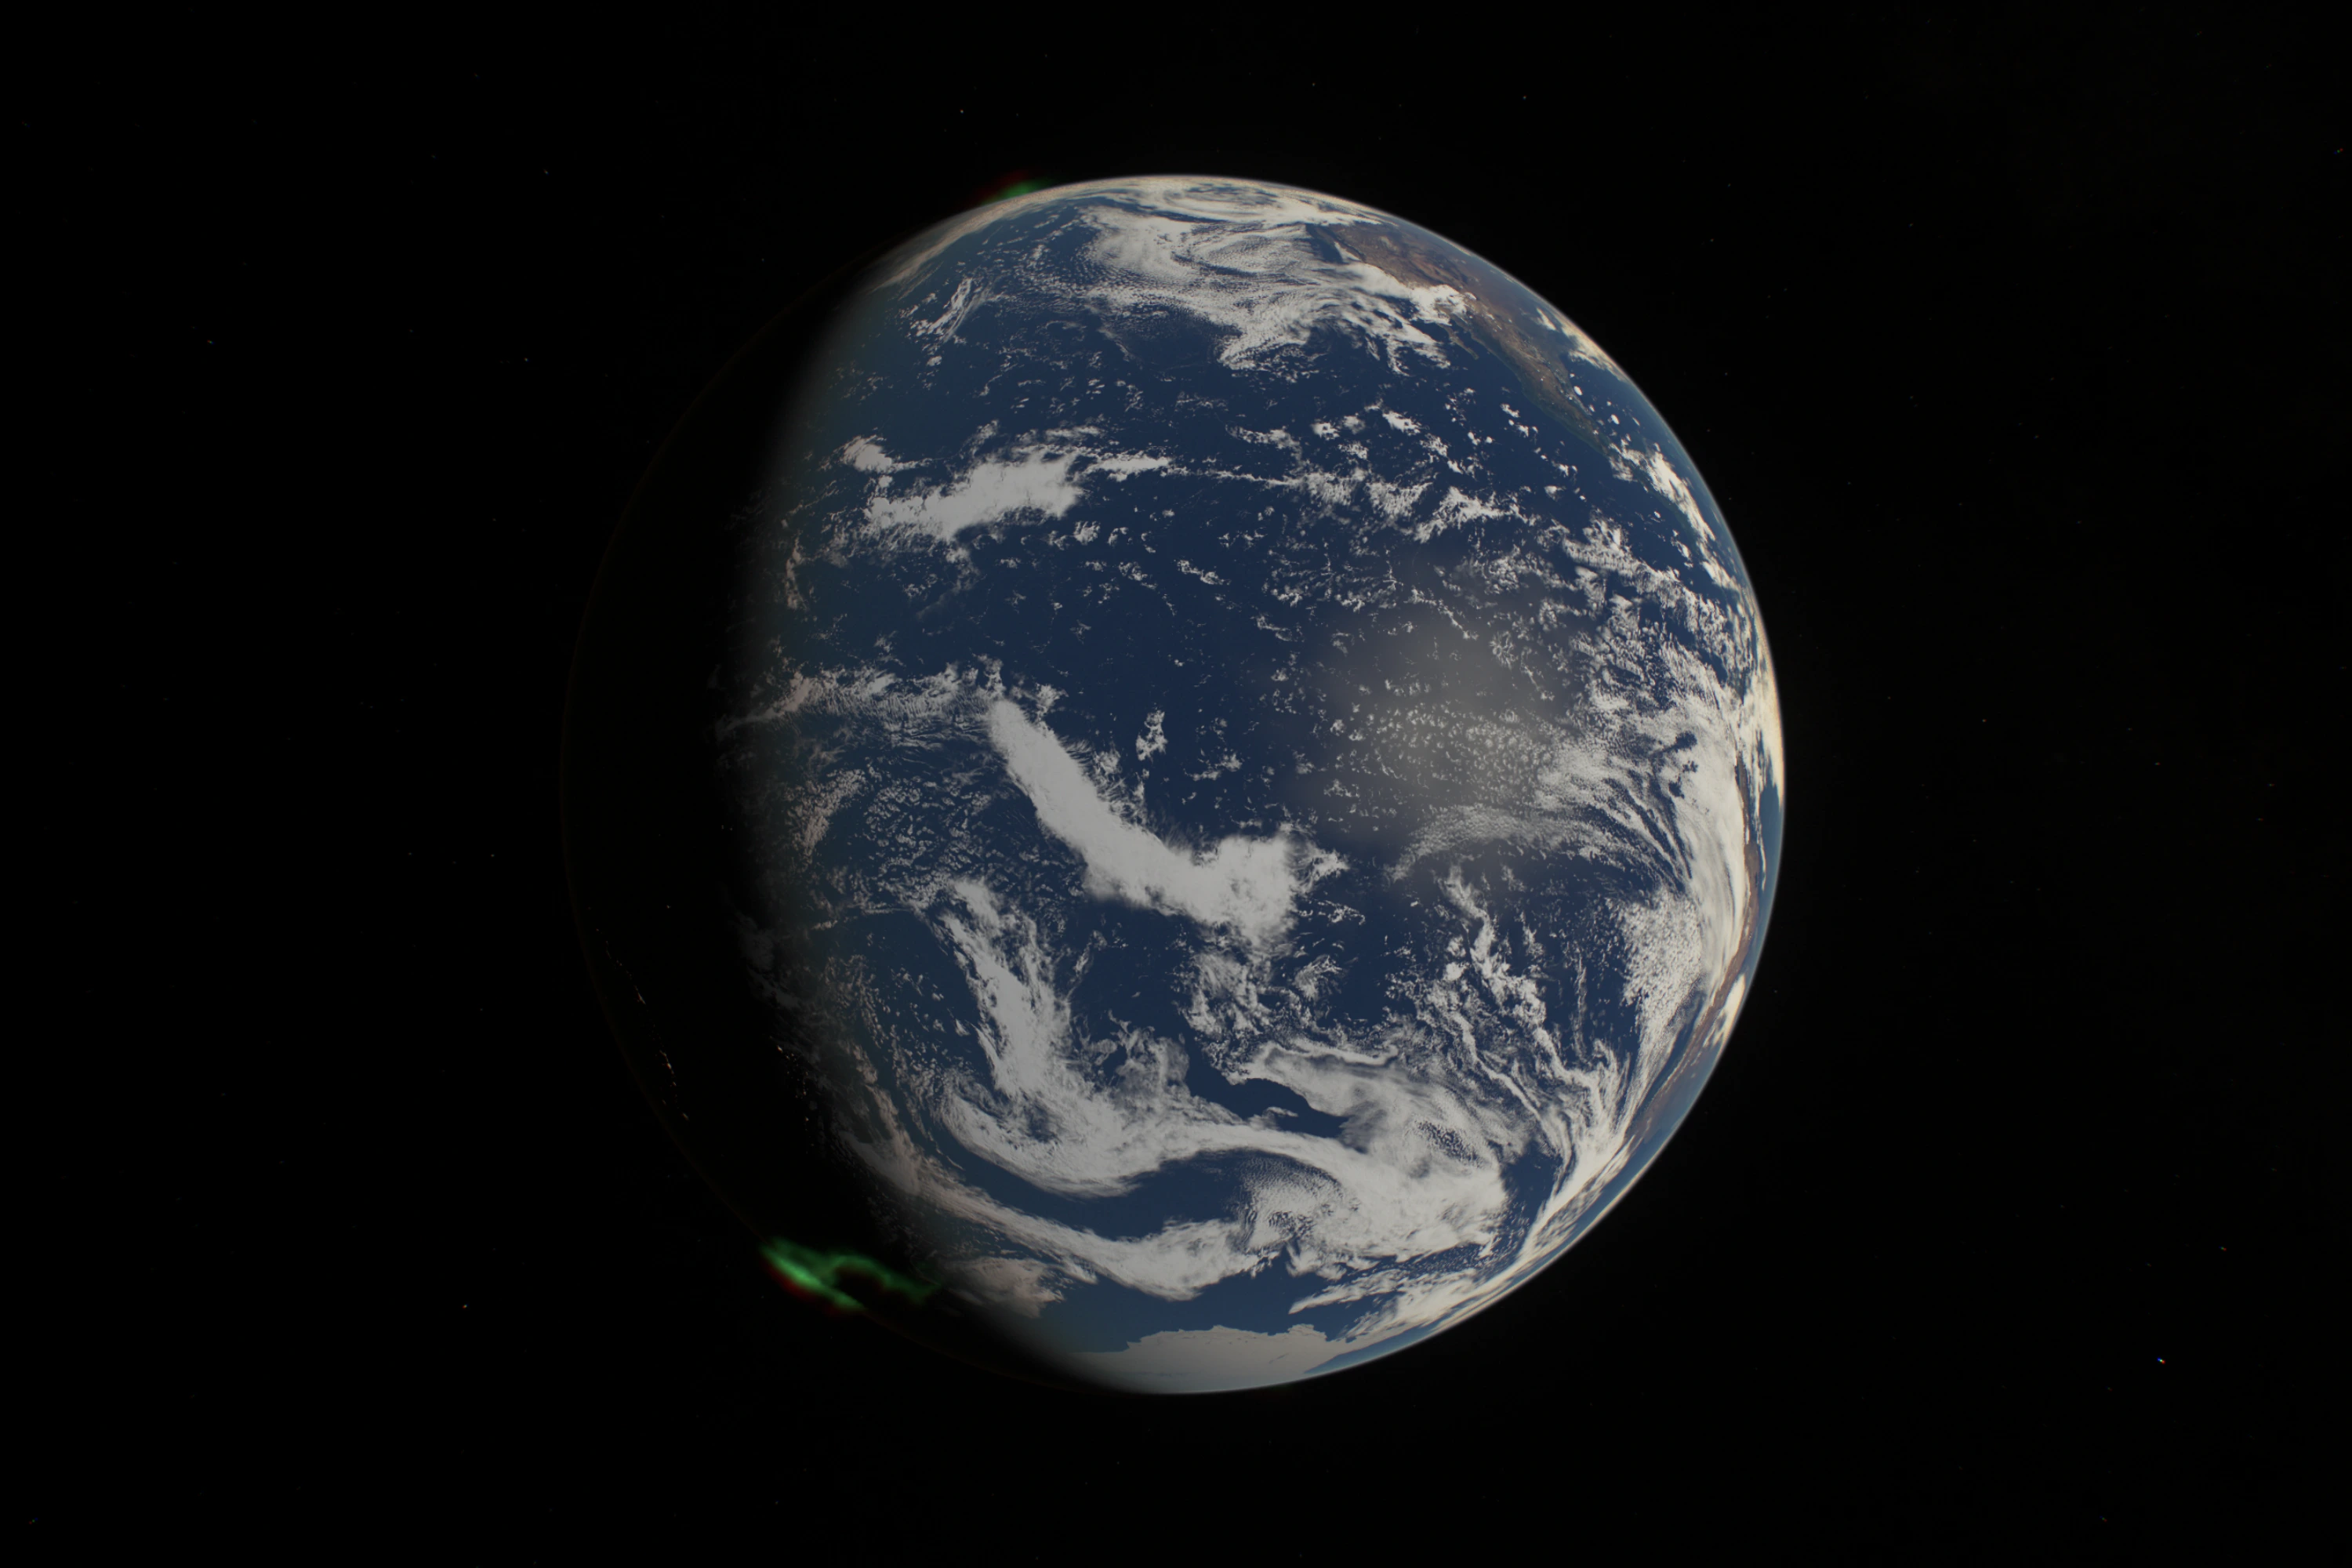
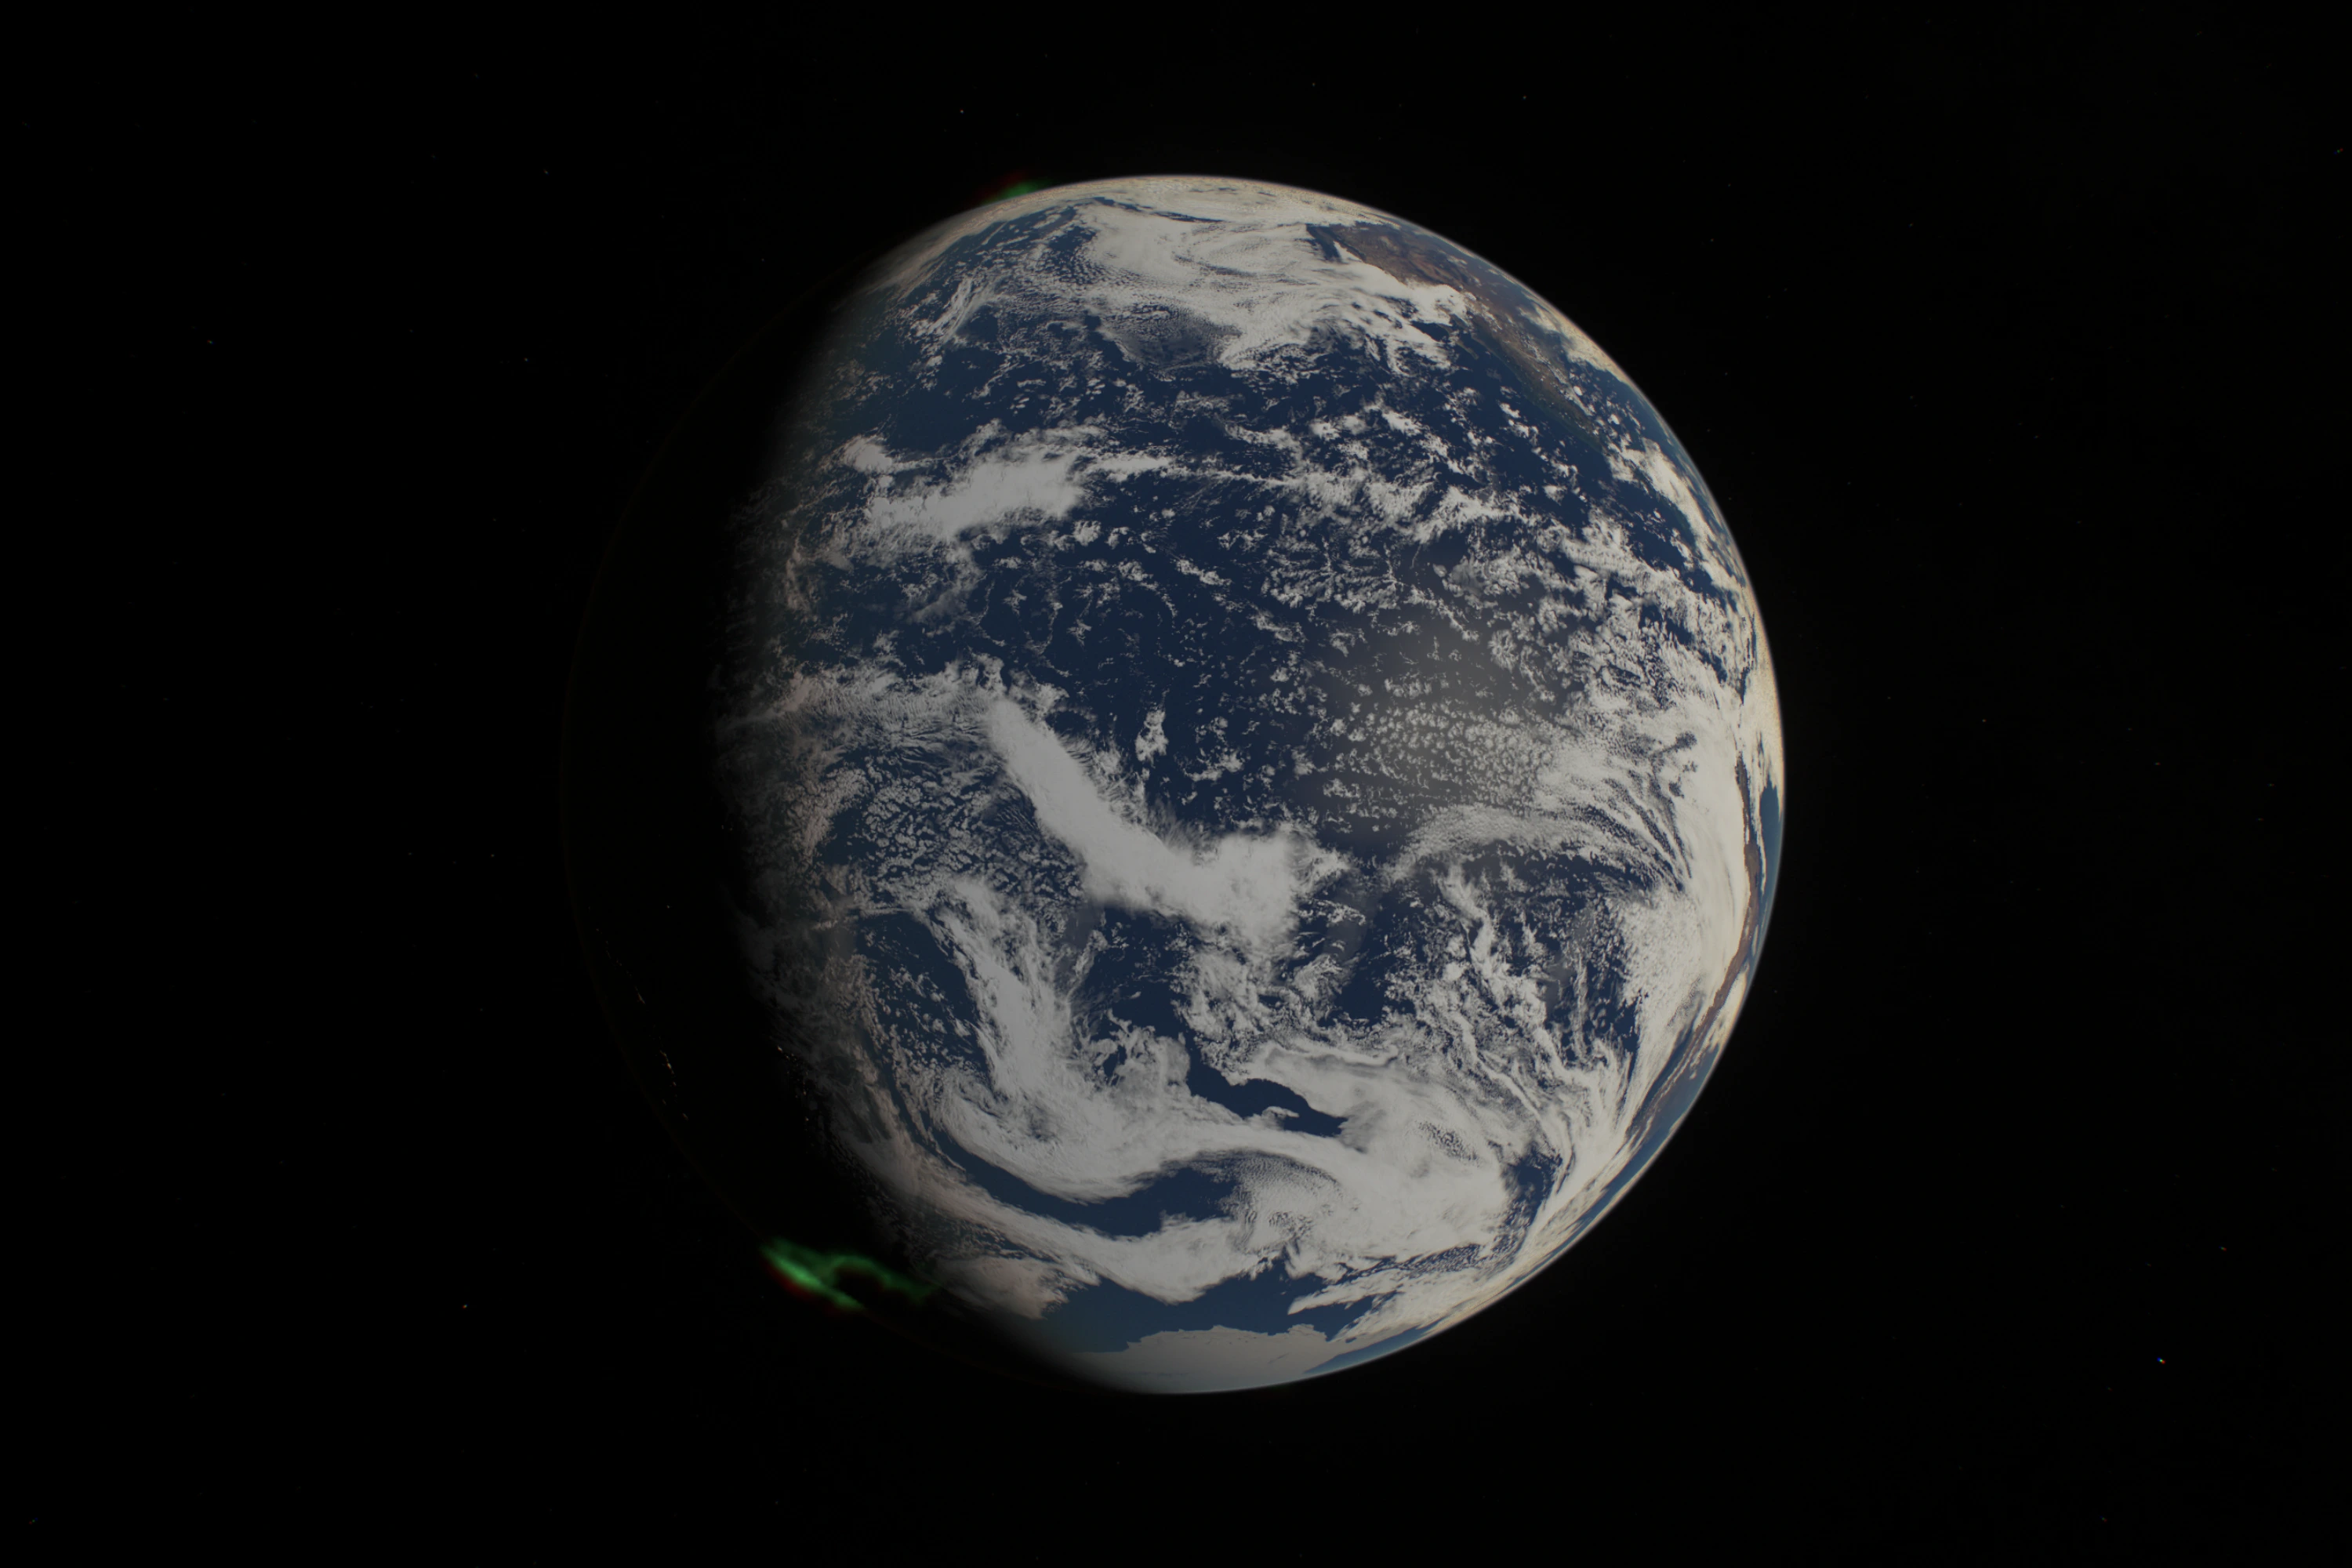
Knowing when to stop was part of the job. I pushed for distinct cloud types and a lab to study them; the fully procedural lab took 186–397 ms per frame, useless for a background. NASA’s MODIS data, which separates cloud-top height, thickness and phase, gave a prototype I couldn’t read. On the last evening of the first week we compared it in the actual scene, and I called it: “It’s not worth it. This has to stop. Commit what we have.” The experiments stay behind flags, along with one day of real weather from the NOAA-20 satellite.
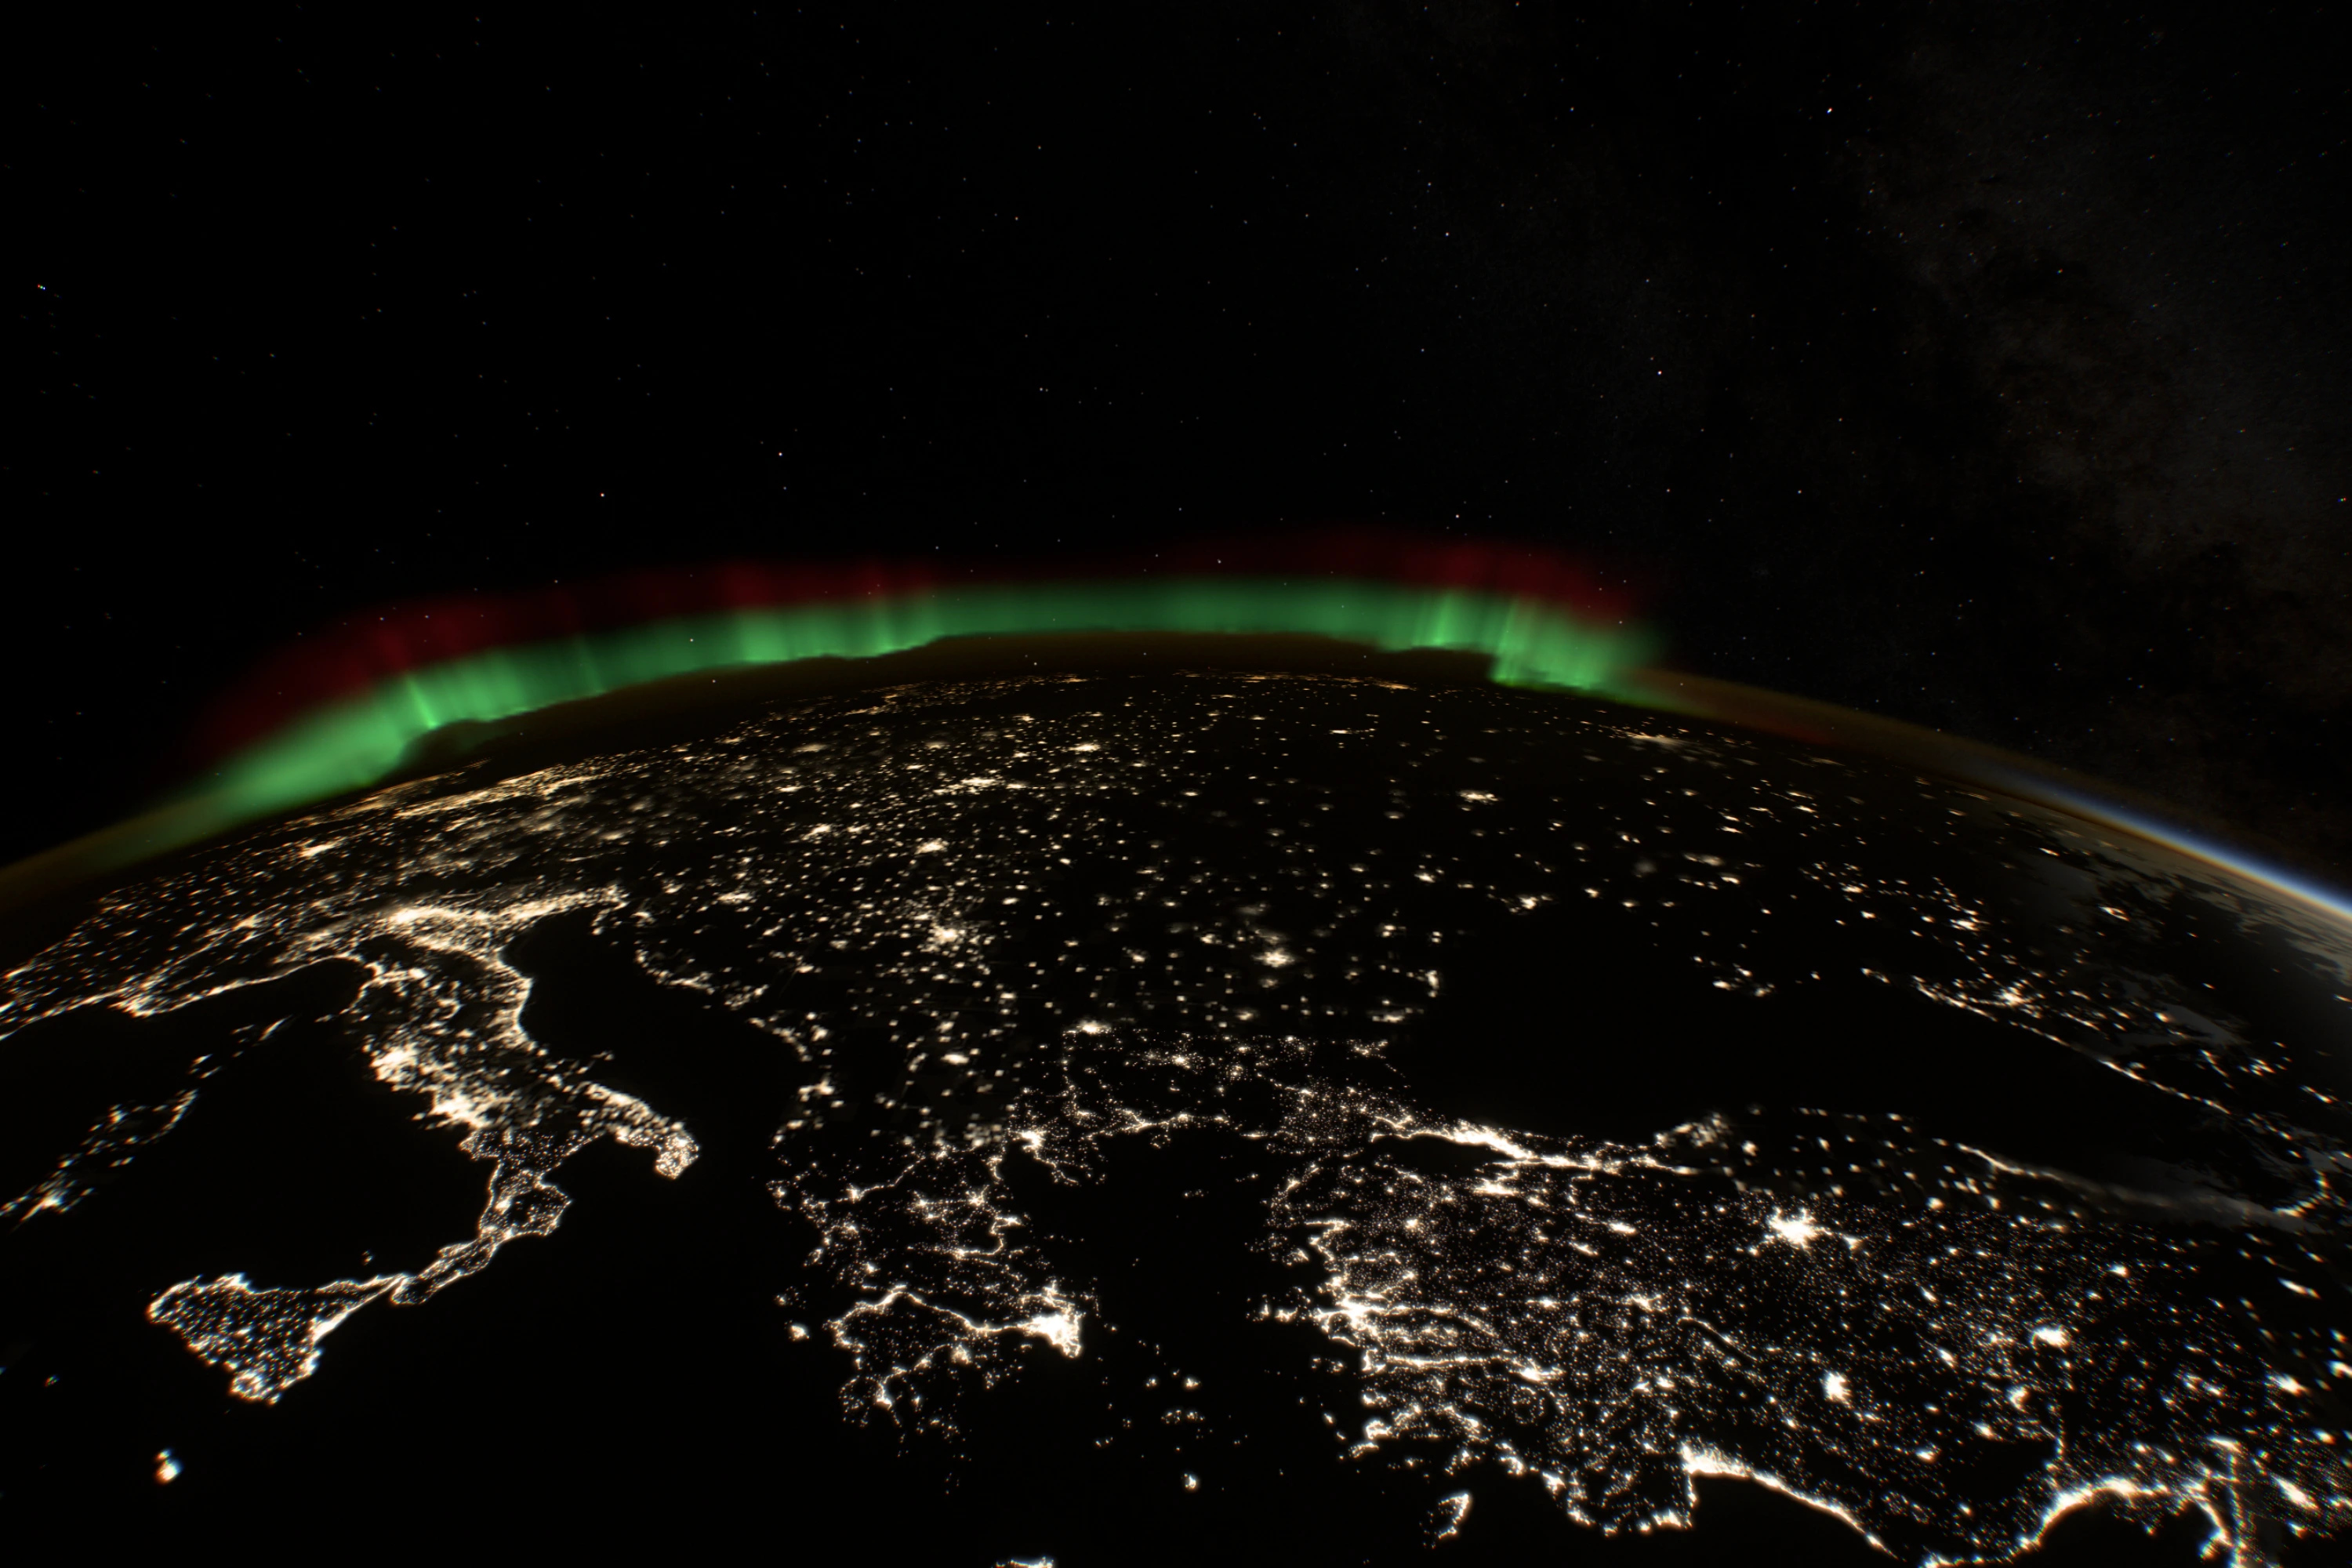
City lights went the other way: there the data was better than my expectations. I brought in NASA’s Black Marble maps, where 97.94% of a test tile was pure black, so the night side streams only tiles that contain light. I expected a pattern like mycelium, clusters joined by roads. Over Africa the faint links were real and had been lost to a contrast curve. In central Argentina the scattered towns along the railways were the real geography, so we left them alone.
 Open this view
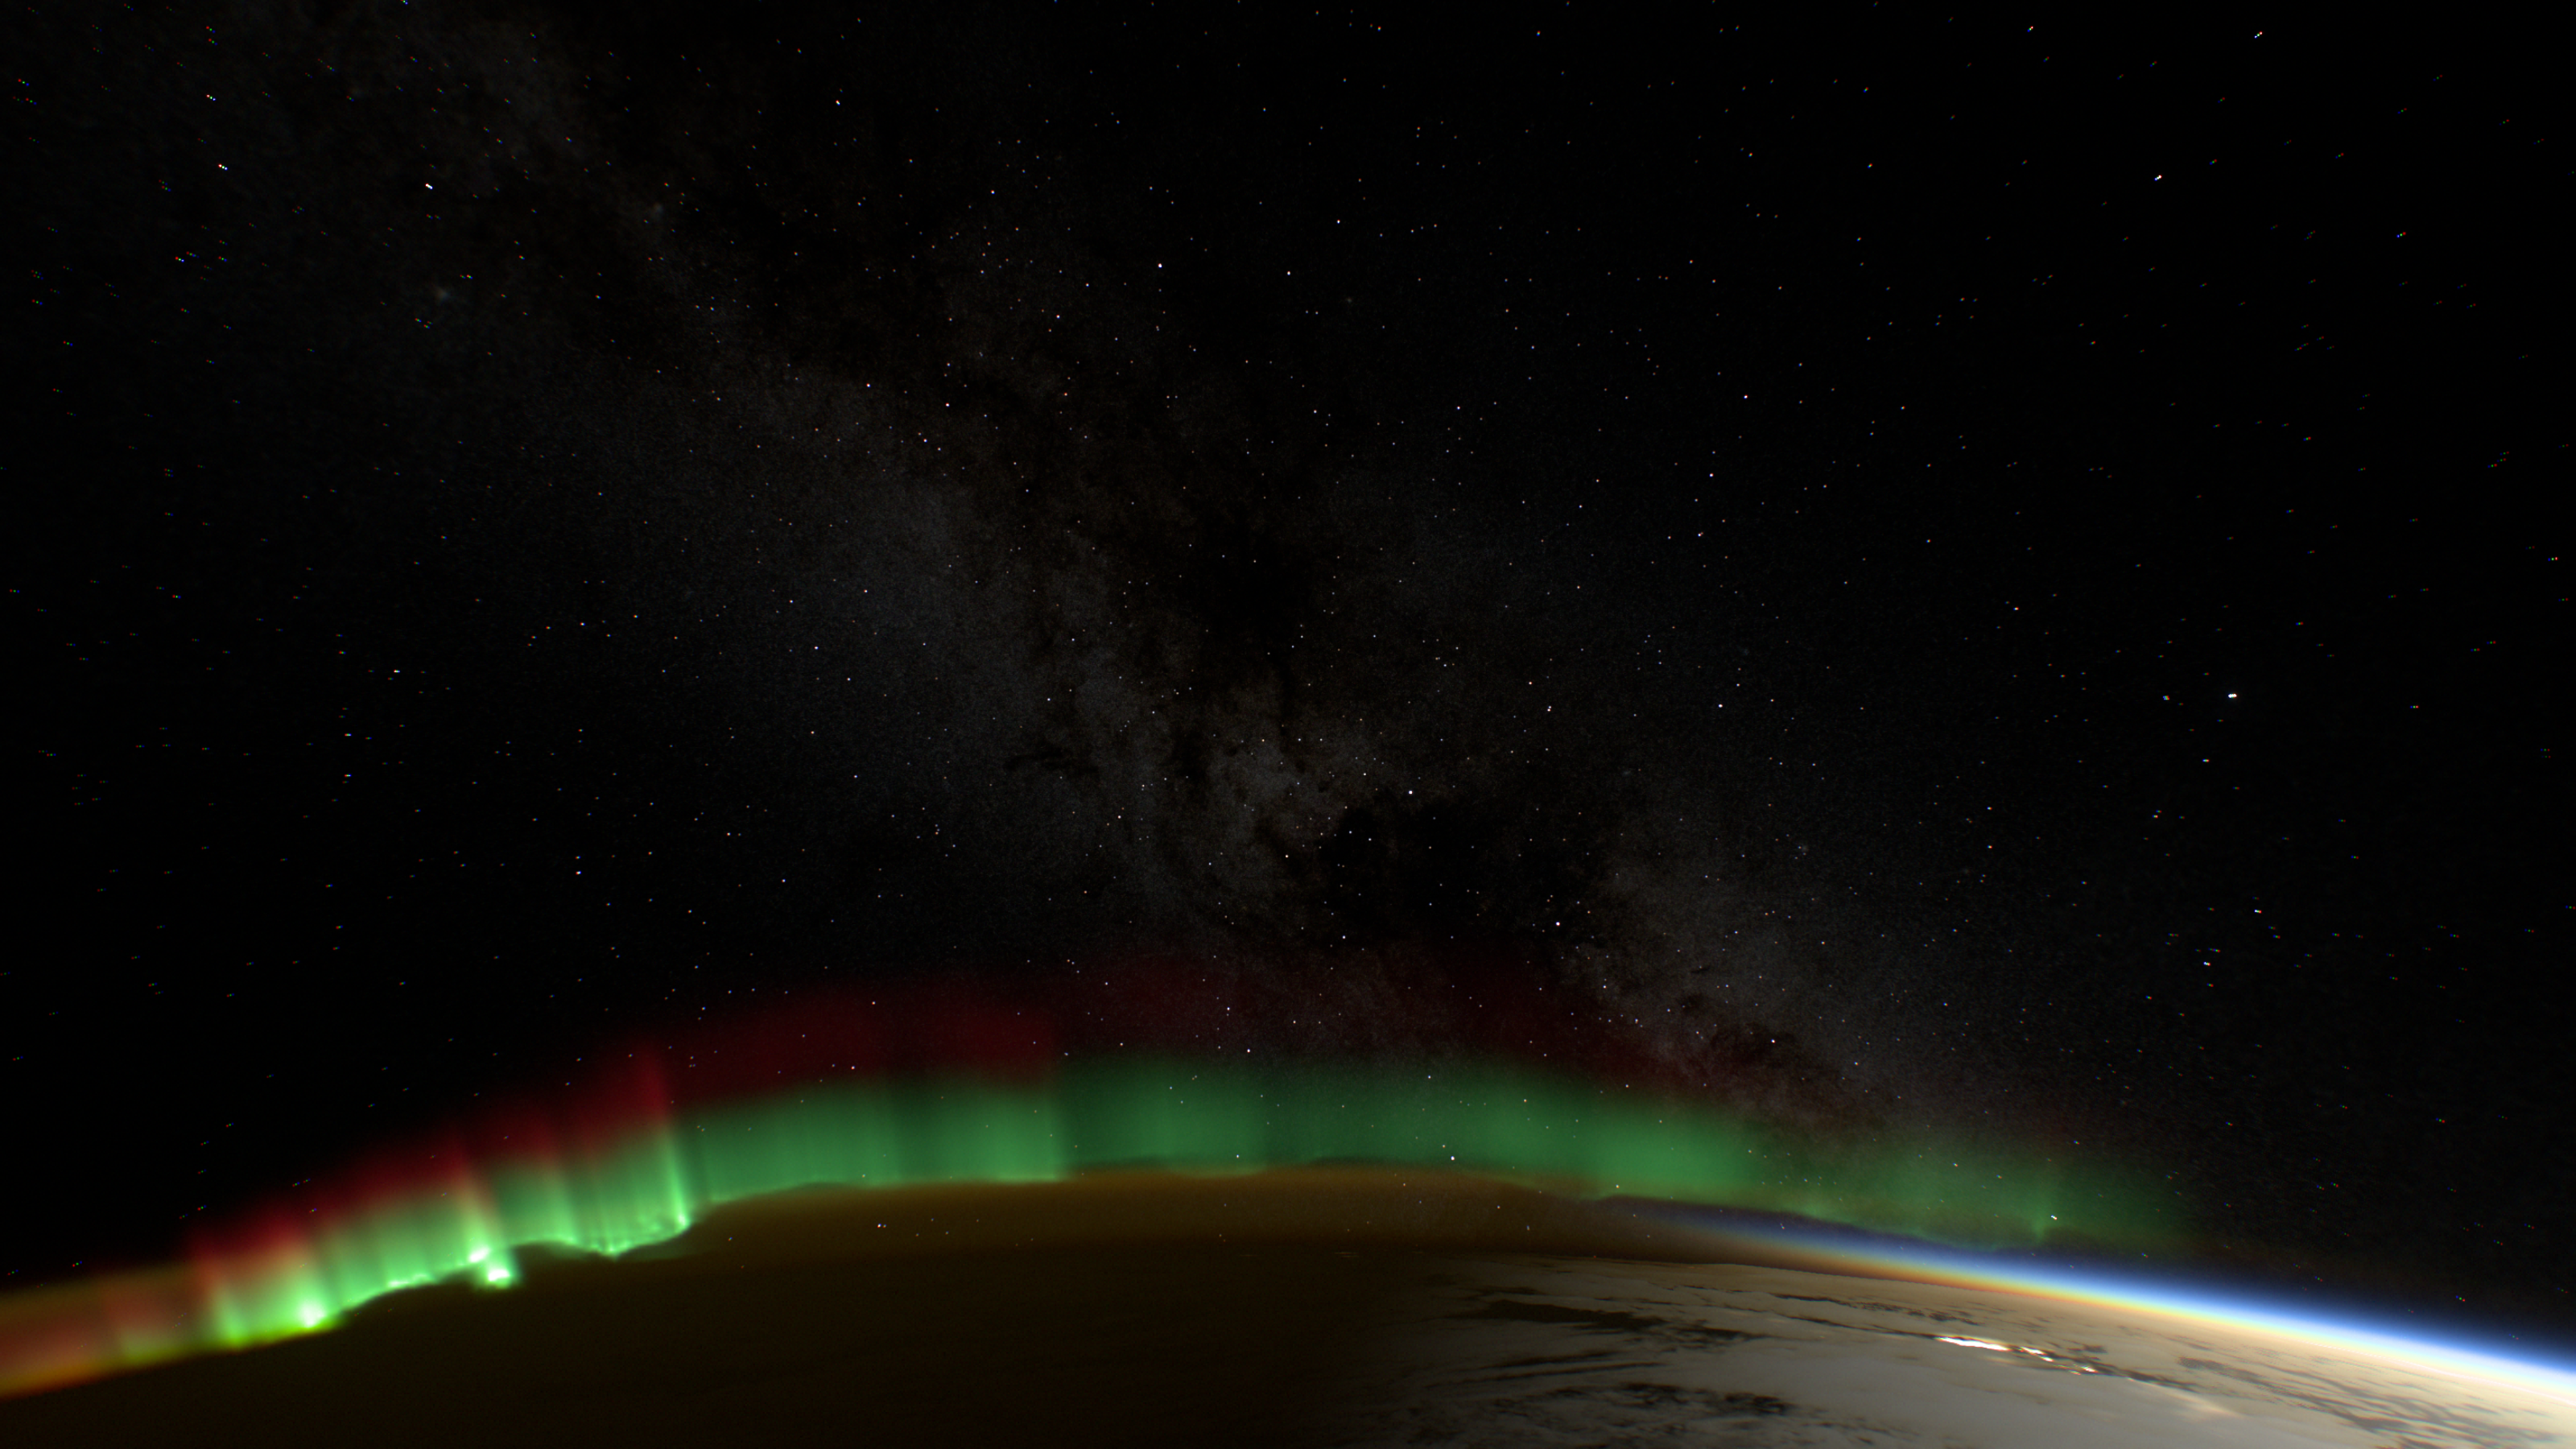
Europe before dawn, with an aurora on the horizon.
The same discipline set the resolution of the relief. When the discussion drifted toward the accuracy of peak heights, I pulled it back to what the eye can see from orbit: sharp ridges and shadows, not half a kilometre of height. One mountain crop in clay at three resolutions settled it. 90 m added the ridges; 30 m added little more for several times the data.
A weak GPU is the benchmark
The scene had to run on other people’s computers, and my M2 Max was the wrong judge of that. I found out on the first Saturday night, when a friend sent screenshots from their PC: 15–20 frames per second on a powerful machine, and Firefox on a MacBook Air had crashed outright. One cause turned up within minutes. When a browser reported a GPU timer, the quality governor stopped watching the real frame rate at all.
So I asked for a test machine that was slow on purpose. When Codex offered a container without a graphics card, I said no: “It has to be a real GPU, even a weak one.” We found one at home, an Intel UHD 630 in a Mac mini, and Codex set up Chrome and Firefox there in real windows. On that GPU a heavy cloudy view took 275 ms per frame. Tighter terrain refinement and sparser cloud steps brought it to 221 ms, and saved 19% on the Mac too.
The architecture had been settled the night before, with two agents arguing over it. I asked Codex to optimise the scene on its own; its first pass mostly turned settings down (“I thought you’d approach this architecturally”). I asked Claude for a second opinion: no to Three.js, because the scene is one full-screen ray-marching shader with no scene graph to manage, and yes to rendering the clouds at lower resolution instead of blurring the cheap, sharp layers. For the next twelve hours I relayed reviews between the two, often adding nothing but “what do you think?”. They caught each other’s overstatements and bugs, and then a real Pixel 9 Pro XL refuted several of Claude’s confident hypotheses.
Two candidates were left. Compact splits the main shader into separate programs with a half-float buffer between them, storing a small correction to an analytic sphere hit, so the worst error is 68 m instead of 24.9 km. It takes 14–19% less GPU time on a Mac. Half-resolution clouds run 1.51 times faster in dense cloud. I compared matched frames on the phone: both held 22–24 frames per second, and only Compact kept the cloud structure that was the point of the scene. It became the default; half resolution stays an option.
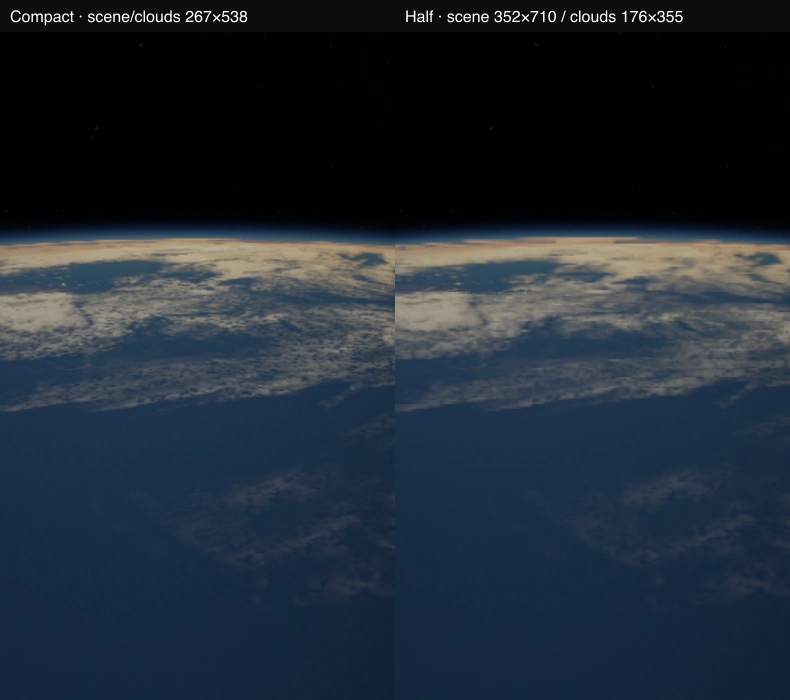
Compact and half-resolution clouds on a Pixel 9 Pro XL.
In the second week Claude made its own pass “without noticeable damage to the picture”, measuring each idea in paired GPU runs and throwing most of them out; what survived made frames 33–38% cheaper. Swipes still stuttered, so I suggested hiding it with motion blur the way a film camera does, on the Earth only so the stars stay sharp. Then Claude found the governor treating every brief stall as overload. Once it learned to wait them out, desktop swipes went from 26–28 to 51–54 frames per second.
Under the hoodTried and not shipped
| Idea | What happened |
|---|---|
| Factored cloud density | Day views got slower; no overall gain |
| Atmosphere lookup table | Accurate to 0.22%, but not fast enough to matter |
| Combining every optimisation | The gains didn’t add up |
| Refining half-resolution cloud edges | Closer to the reference, but 66.6% more GPU time |
| GPU texture compression everywhere | Faint data such as night roads would suffer, and decoding has a cost |
| Fixed canvas and buffers | Fewer resizes, but the waiting moved elsewhere |
| Keeping tile atlases longer | Resolution, not uploads, drove the stalls. Not worth 83 MB |
| Remembering quality per pose | Stopped to protect a clean baseline |
Flight became the test rig
I wanted free flight for fun. It became the best testing tool in the project, because every new viewpoint exposed something the default view had hidden. From far away the night side glowed with no light source, a Sun hidden behind the Earth still had a halo, and the aurora formed a neat cap. Every view is also a URL, with the time, position, lens and exposure, so a bug report is a link and any screenshot can be reproduced.
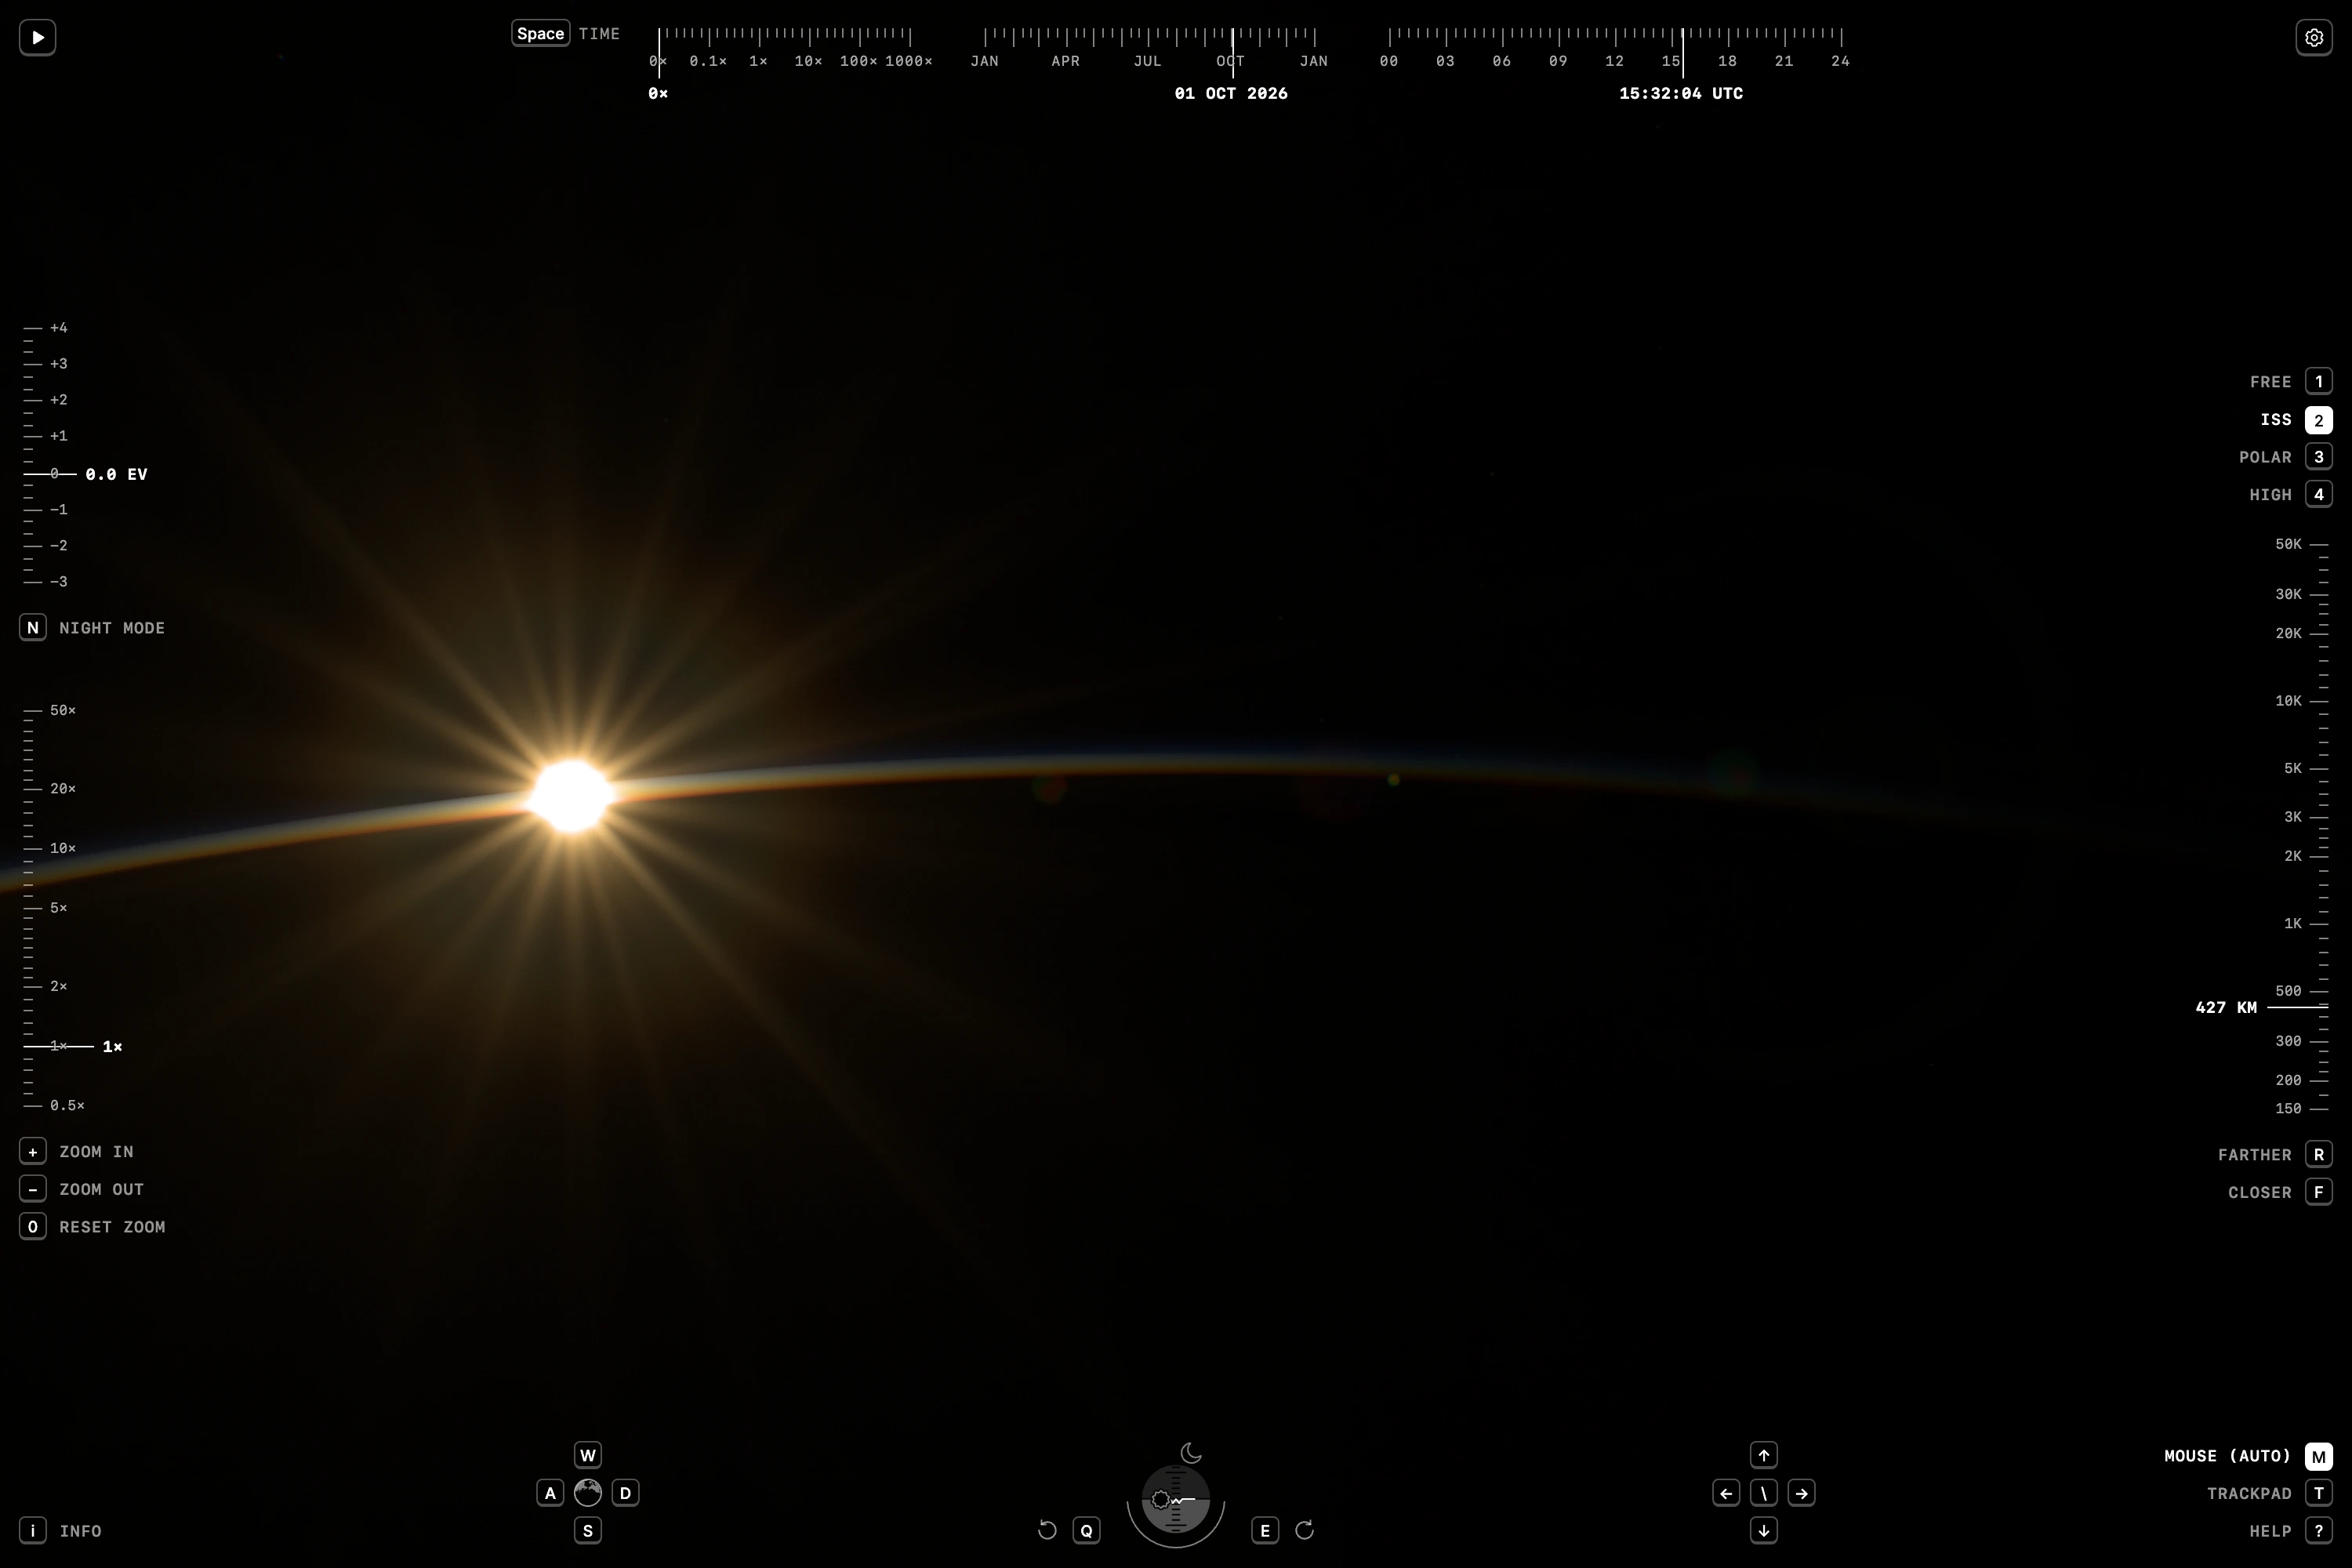 Open this view
The HUD after its design pass.
The controls took two rounds, and in the second I overruled my own earlier call. Claude’s first rule was that whatever is under your finger moves with it: drag the Earth and it turns like a globe, drag the sky and you turn your head. When looking around proved hard to discover, Claude offered to drop the rule, and I didn’t let it, because the problem was in the gestures, not the idea. Five days later I dropped half of it myself. Dragging the sky confused more than it helped, and I admitted: “I can’t fit the full model of touchscreen, trackpad, mouse and every interaction in my head.” Now the main gesture flies over the Earth wherever it starts, Shift or two fingers look around, and a right-drag circles a point that gets a pin on the ground, because “when you circle around a point, it isn’t clear which one”.
The interface itself was designed in one day of one-line notes to Claude, almost 70 of them: “Remove the focus rings.” “Why is the roll card a different colour?” “Too far. 2 px to the right.” The panels, blur and hint text went. What’s left reads like a cockpit: tapes for altitude, lens, exposure and time at the edges, and a horizon gauge whose arc closes when the whole planet is in frame. On a phone the gauge doubles in size so a finger can hit the Sun marker, and a pinch zooms only after a threshold, because “with two fingers you’re usually steering the camera”.
A lens matched to ISS photographs
The Sun’s rays now come from the lens the station’s crews actually use. They started as a six-pointed star that “looks literally like a decal, not a real flare”, and I didn’t know why. The references were about 300 NASA photographs from the station, most taken with a 28–300 mm lens that has nine rounded blades. Nine rounded blades give eighteen rays, which was “still very geometric”; what fixed it was micron-scale waviness on the blade edges, so the rays differ in strength and width.
By then three sessions were working on flares in parallel and I’d lost track: “Lay it all out for me. I’m confused.” I asked for a board with a reference and our current frame side by side for each defect, so every session had one goal: make it look like the reference. Then the strongest check: cut a lens-flare video into 32 frames and compare every phase with ours. It found that our ghost reflections were about 30 times weaker than in the video, and that this was correct, because the station’s lens is coated and the one in the video isn’t. The coated lens stays the default.
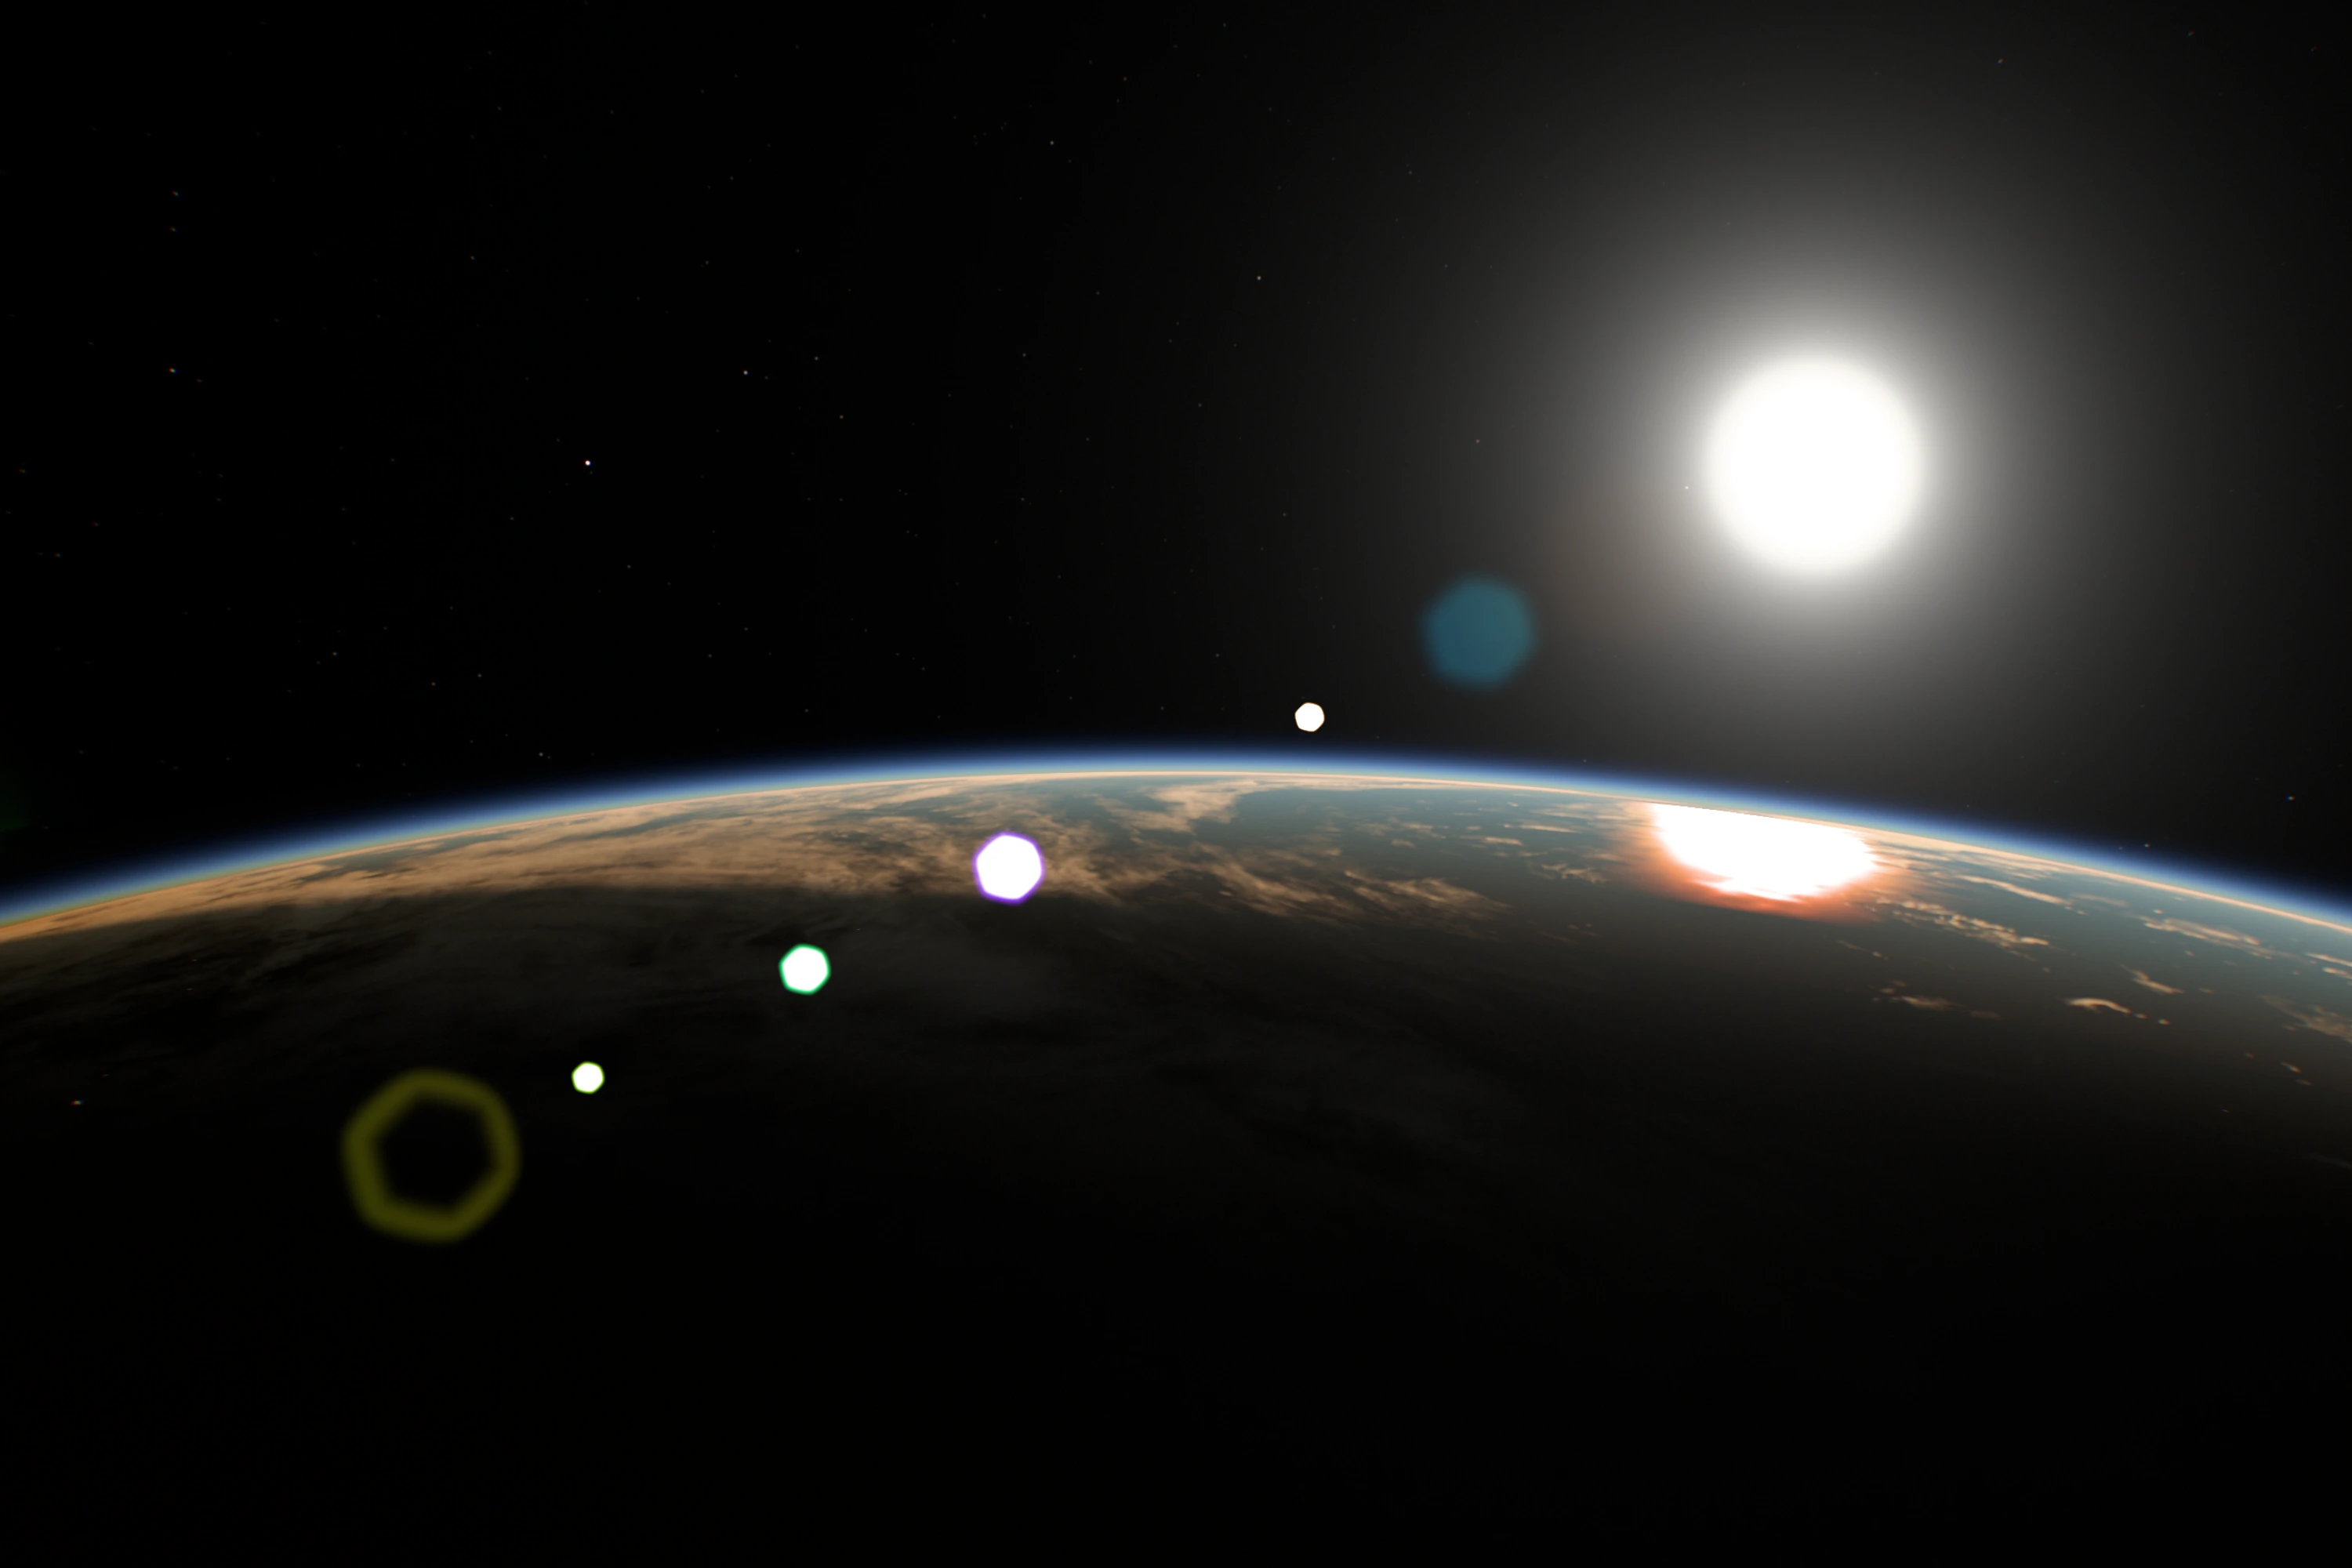
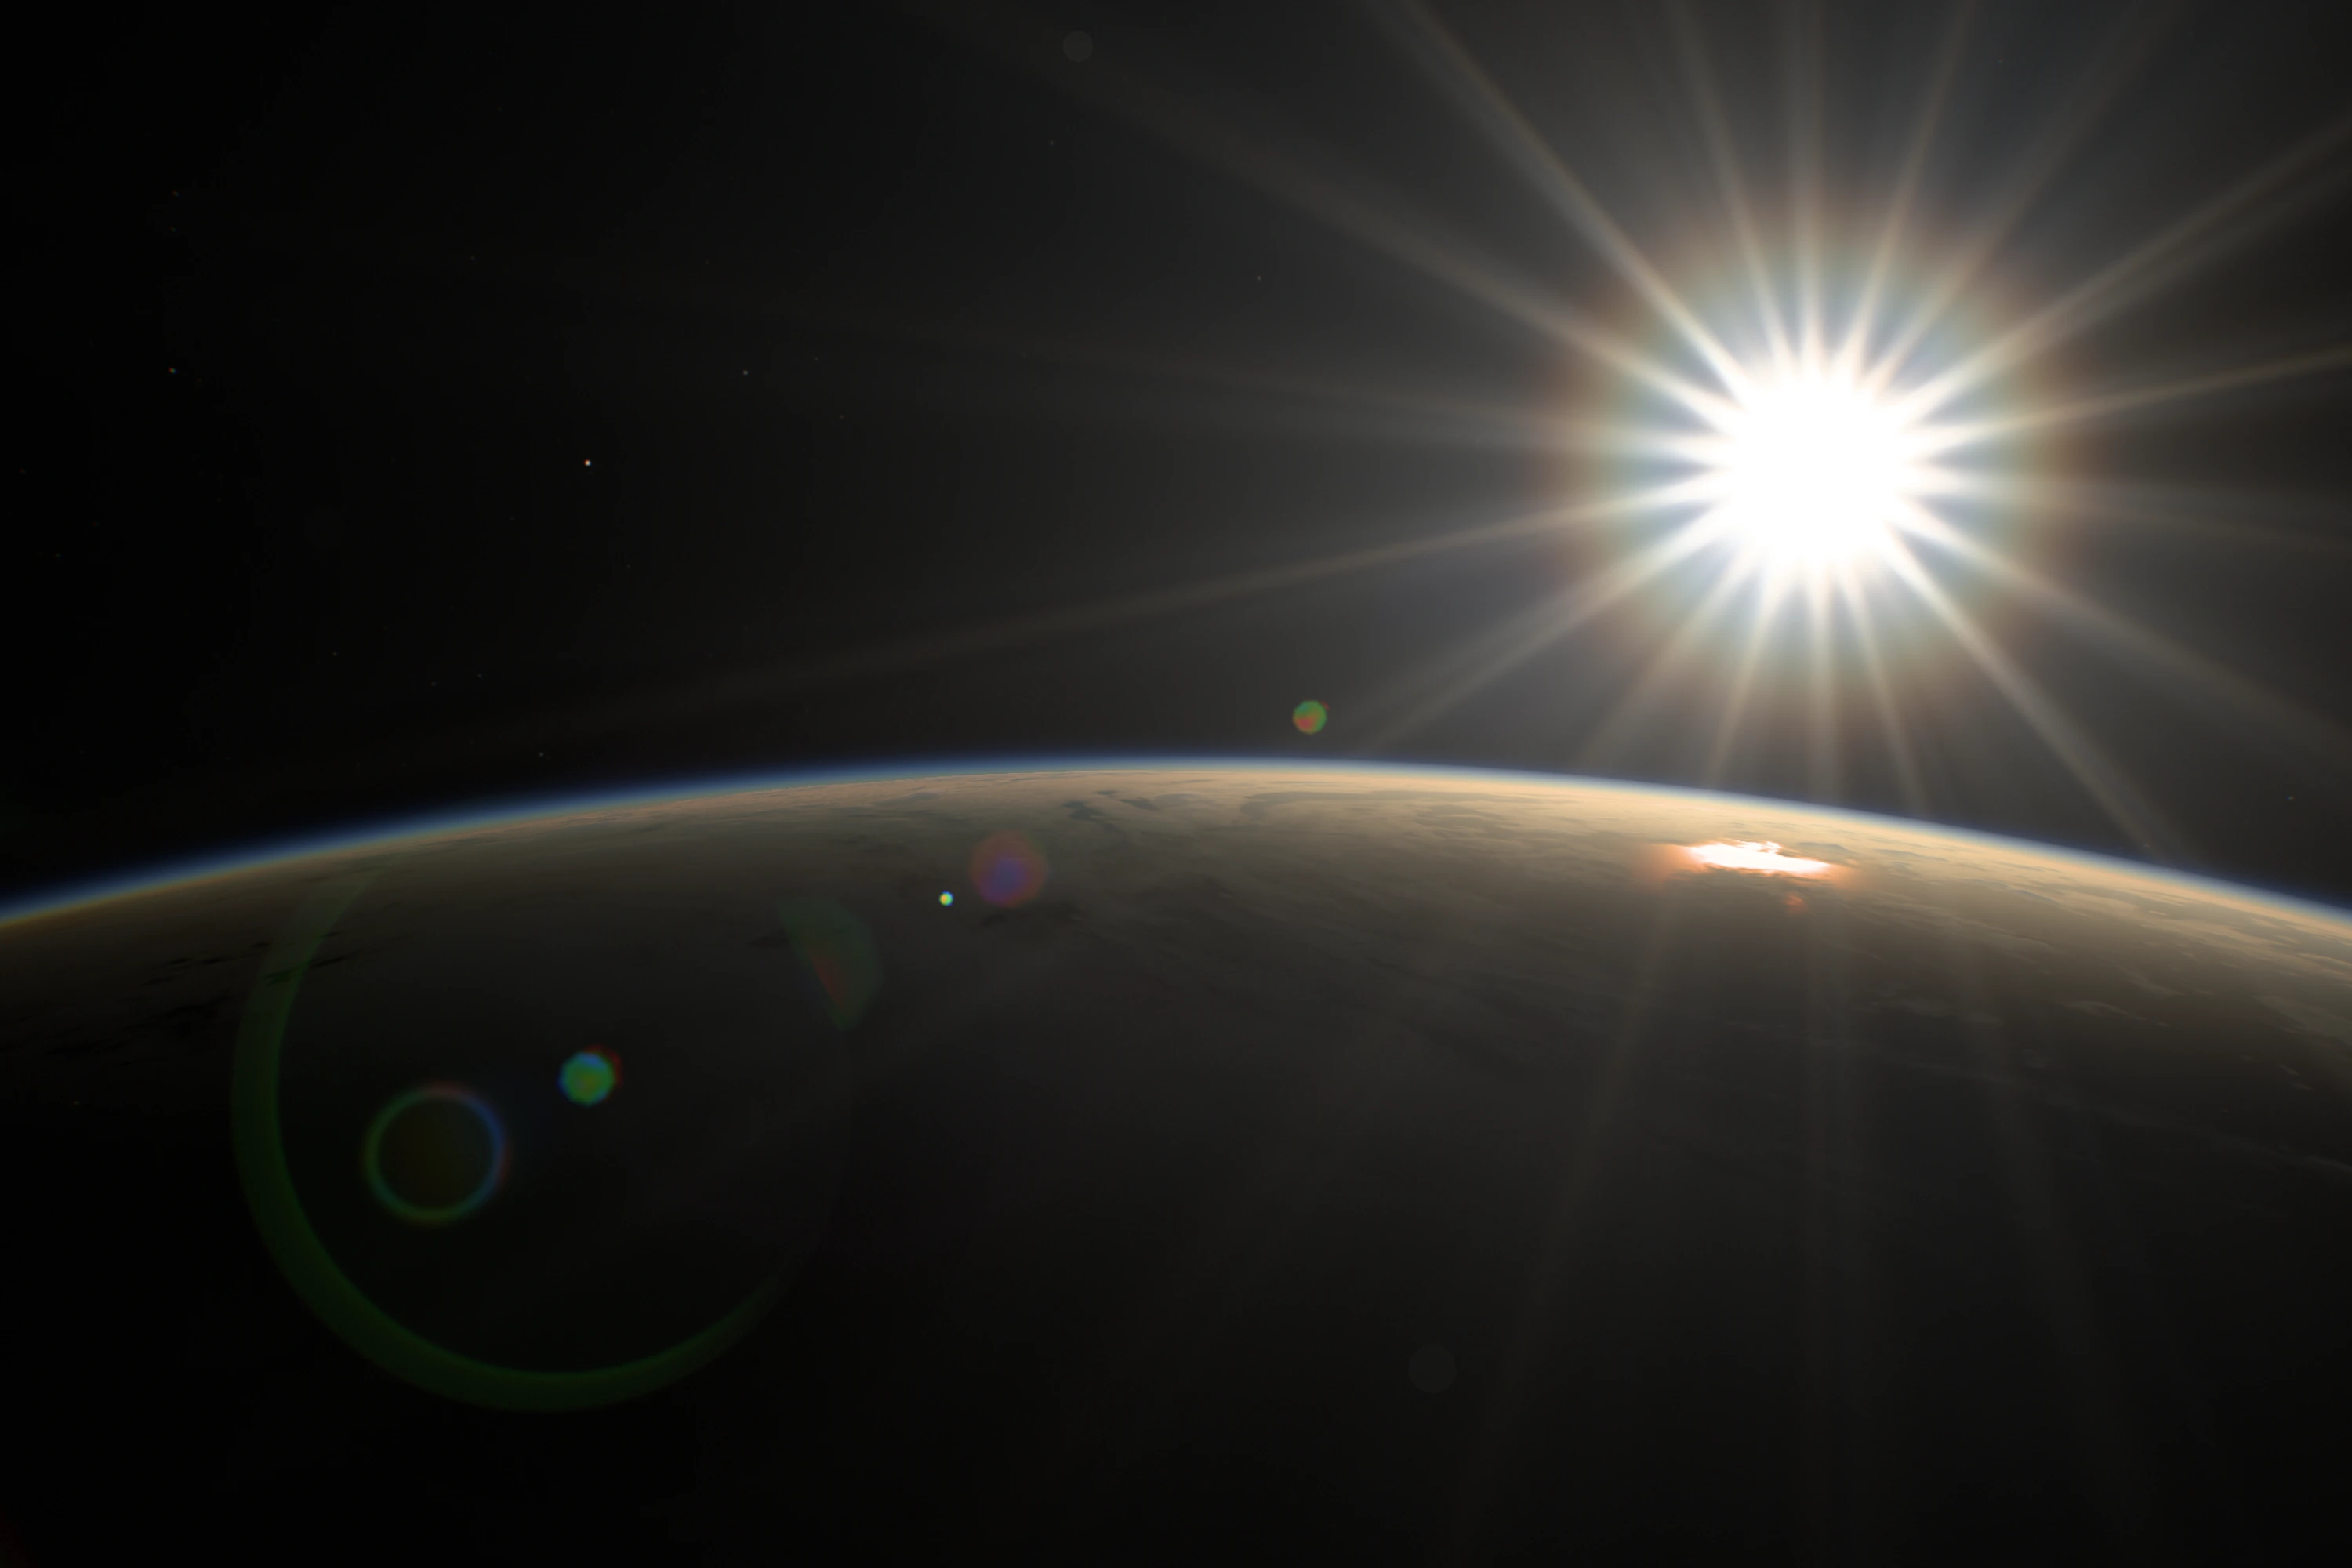
Real detail at 50×, and a scene that loads into focus
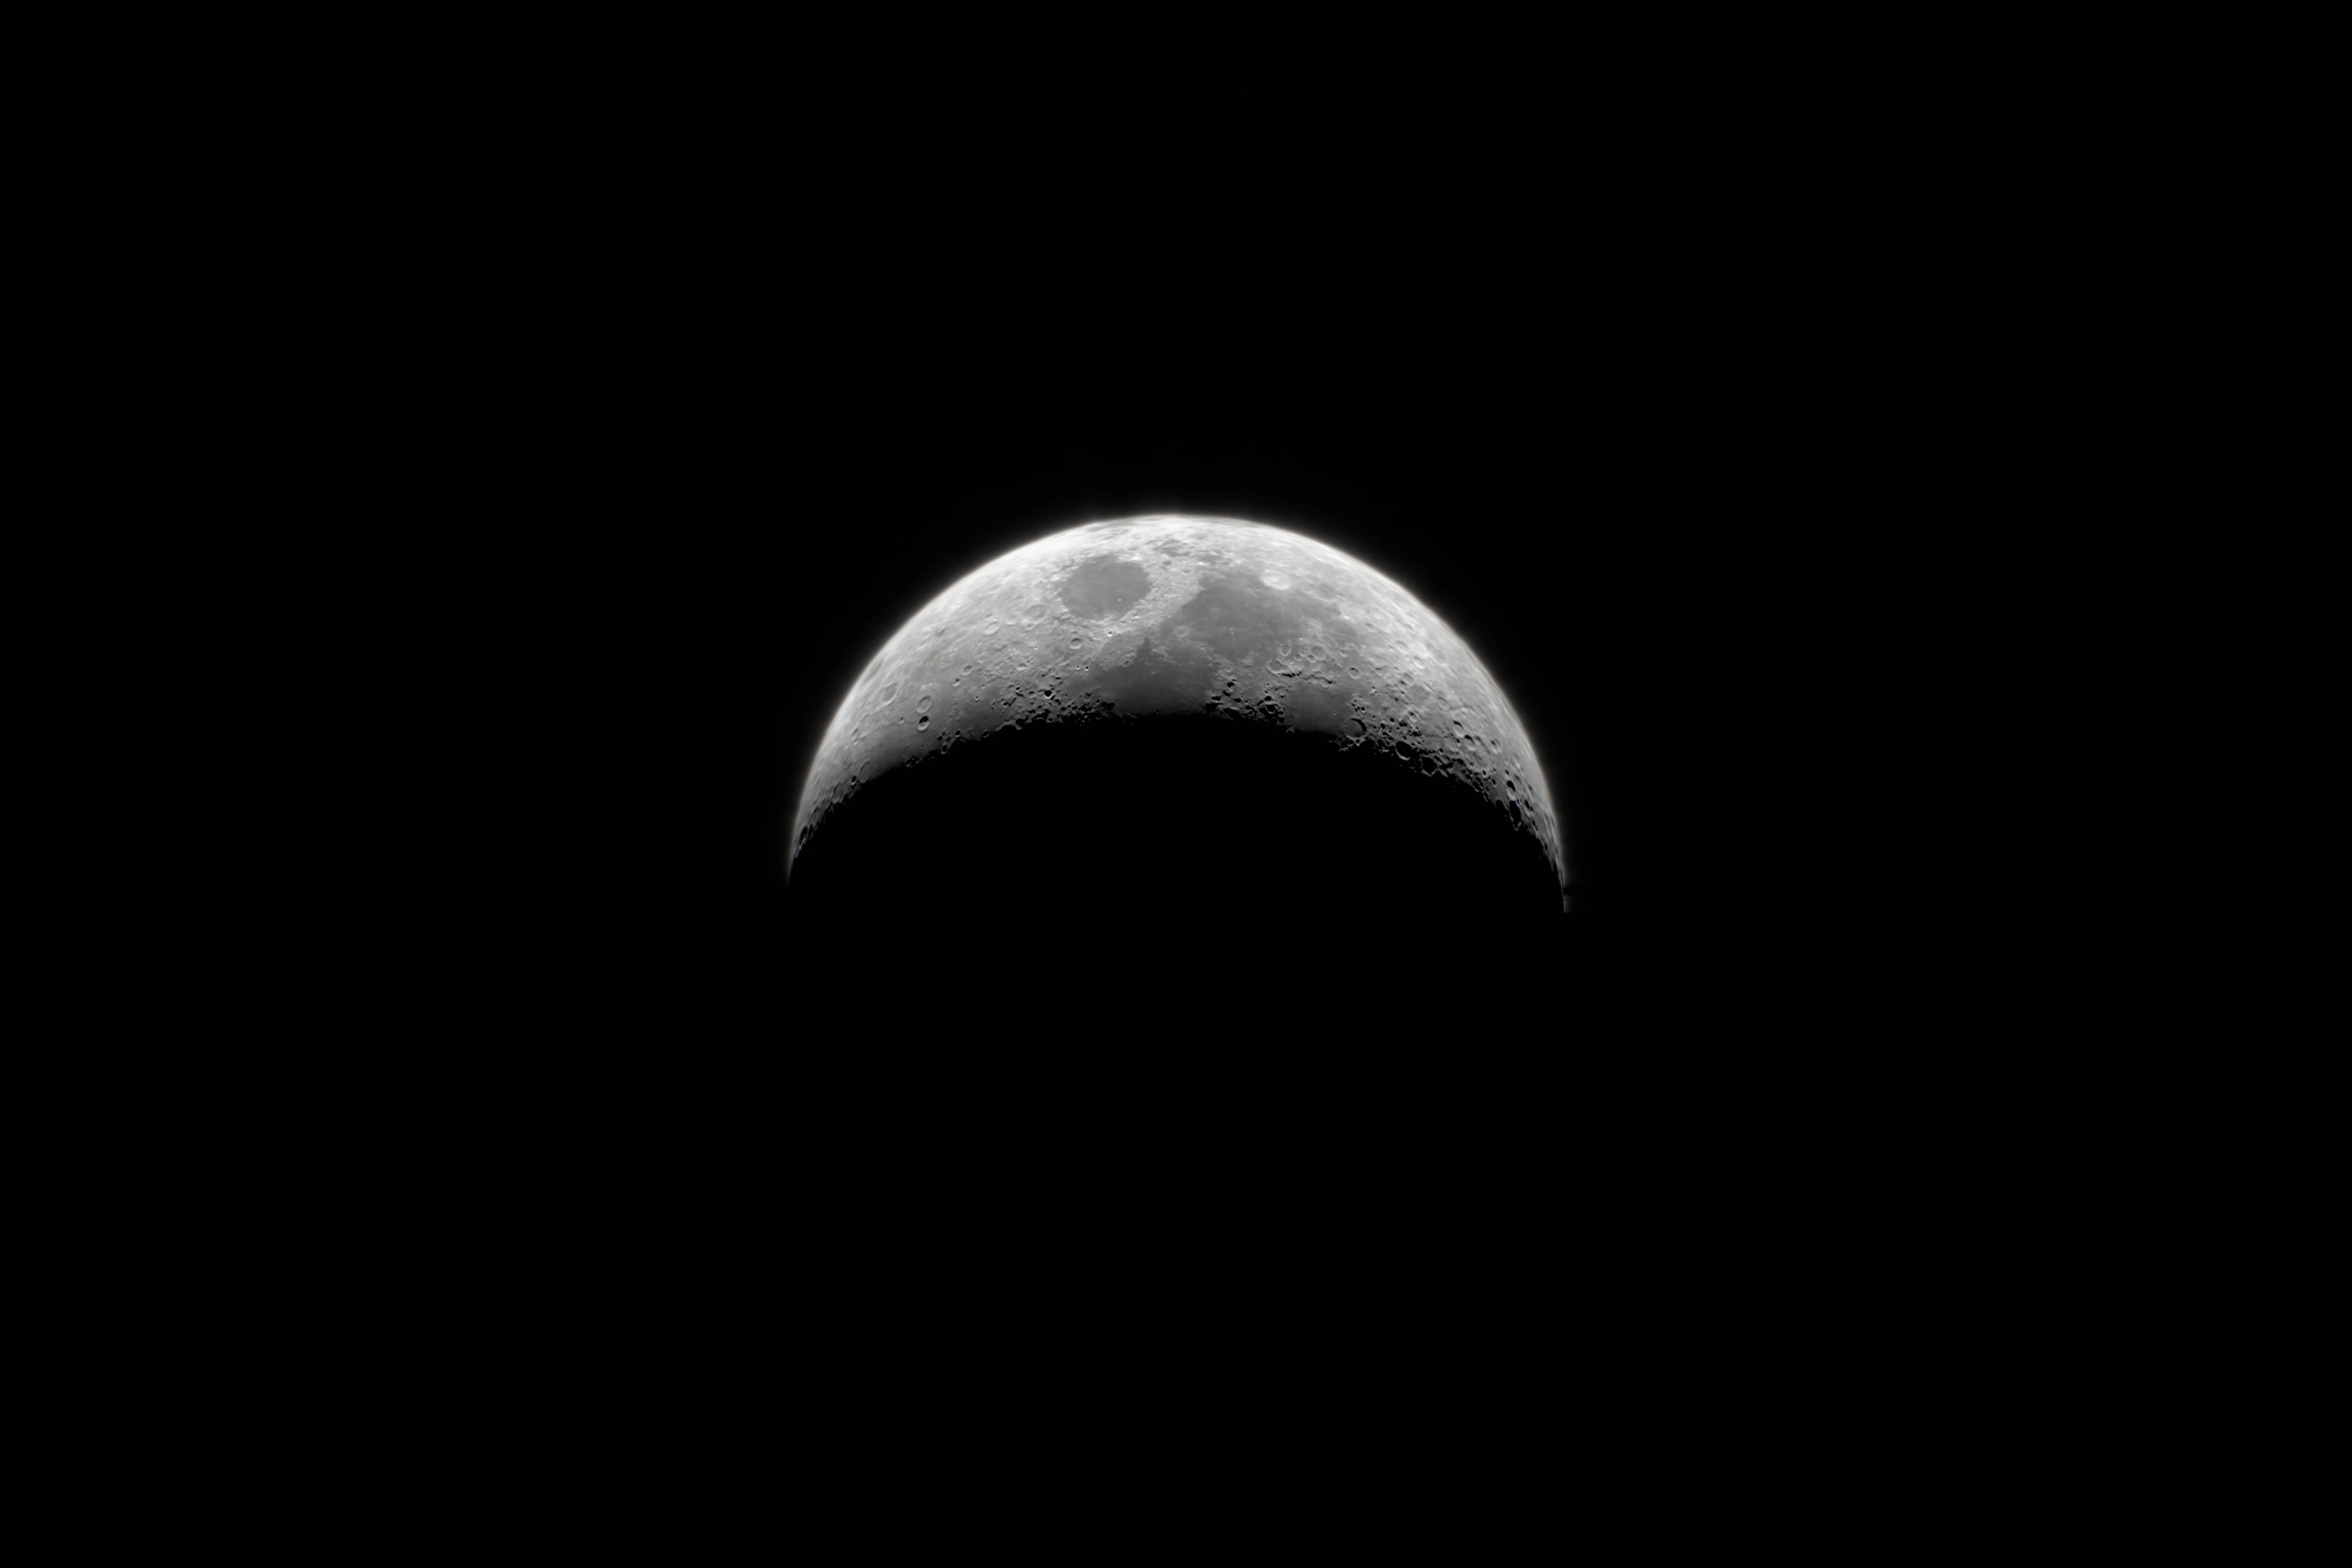
I wanted to zoom on the Moon at 50× and to hide the Earth’s pixels at that zoom behind defocus. Claude answered that the first could be done honestly and the second couldn’t: at 750 mm and f/8, anything beyond about 3 km is in focus. So the answer was the opposite one, real detail where it exists. The Moon got NASA’s lunar maps, lit by the real Sun and loaded only once it’s large enough to need them. City lights turned out to be 1 km data labelled 500 m, and smooth interpolation on the true grid replaced the blocks.
The lens now reaches 50×, about 1,500 mm.
The daytime surface could have gone much sharper with Sentinel-2, but the whole world at 10 m meant about 1,400 CPU-hours and a monthly storage bill. “As described, it isn’t worth it, and I don’t want to pay for it.” At 62.5 m, matching the relief, it’s 3.1 GB and cost nothing, and it waits behind a flag until I accept what each close-up would download.
The last thing that still looked like software was loading: on the homepage the scene started as “a very blurry, very scary picture”. Now the first frame is a defocused poster of a few kilobytes, picked by where the Sun is, and the lens pulls focus as detail arrives, so waiting looks like a camera finding focus. On a slow 4G connection first light is complete in 1.08 s instead of 4.90, and the full scene went from 15.1 to 9.5 MB.
How it was built
Earthlight was built with AI agents, and the way of working changed between the two weeks. In the first four days Codex on GPT-6 Astra wrote most of the code, while Claude reviewed the architecture, designed the flight controls and named the project, after Arthur C. Clarke’s Earthlight. In the second week Claude did most of the work, in parallel sessions it started itself, and when one of them got stuck I moved the job to another. On 18 October eight GPT-6 Astra agents, handing routine parts to GPT-6 Sol, gave the renderer one lifecycle for the background and the full scene; all 1,680 shader header configurations came out byte-identical. Codex then extracted it into Earthlight, a framework-free web component, open source on GitHub under MIT, with every data source credited.
The work ran as a loop, written down on the first evening and repeated hundreds of times:
- SeeSomething looks wrong in a specific view
- DescribeName the symptom, not the fix, and attach the frame
- Find the causeReferences, a control view, fixed exposure
- Change the model
Then check it from another distance, angle and in motion
I couldn’t name the bug, but I could name the symptom precisely: “circles of coloured paper”, “glued to an invisible sphere”, “a drop of kefir on snow”. As I once put it to Codex: “I only see and feel that something is off. Beyond that, you know better.” Plenty of the dead ends were mine too: procedural continents on the first evening, the +2 EV, the cloud lab and thinner clouds. The loop worked because a wrong turn cost hours, not weeks.
- 18:09: “a WebGL background with some stars?”
Then the wallpaper, a first prototype, a failed escalation and a rollback. By midnight: the real ISS orbit, a star catalog and NASA’s Milky Way.
- The busiest day: 141 messages.
City lights, volumetric clouds and lens flares. I turn the camera toward the Sun, and we start building a real camera. Auroras arrive in the evening and free flight after midnight.
- Architecture variants for speed.
And after midnight, the light meter rebuilt from scratch.
- Earthlight becomes its own project.
The aurora rebuilt overnight, two agents reviewing each other, a real phone settling the renderer, and the last experiment stopped at 19:40.
- The second pass.
A weak GPU becomes the benchmark, the interface gets designed in a day of one-line notes, and the lens, the clouds, the Moon and the loading screen are rebuilt against references.
- 97 hfrom the first message to a renderer of its own
- 509messages from me: 264 in the main chat, then 245 in the second week
- 174screenshots and references I attached
- 122commits: 19 to the site, then 103 to Earthlight
- 71lab notes with measurements
Some limits, honestly. The orbit, the sky and the maps of land, night lights and clouds are real data, but the clouds are a 2001 composite, not today’s weather. The aurora is procedural on a real magnetic model, and the lightning is illustrative. The camera is plausible, not calibrated, and the default night is many times brighter than a real camera would see it. That’s the look I chose; night mode, the N key, switches to a physically exposed night, much darker, like ISS night video. The ocean still isn’t where I want it.